Zip Codes with the Highest Percentage of Population Employed in Food Preparation & Serving in Benton, AR
RELATED REPORTS & OPTIONS
Food Preparation & Serving
Benton
Compare Zip Codes
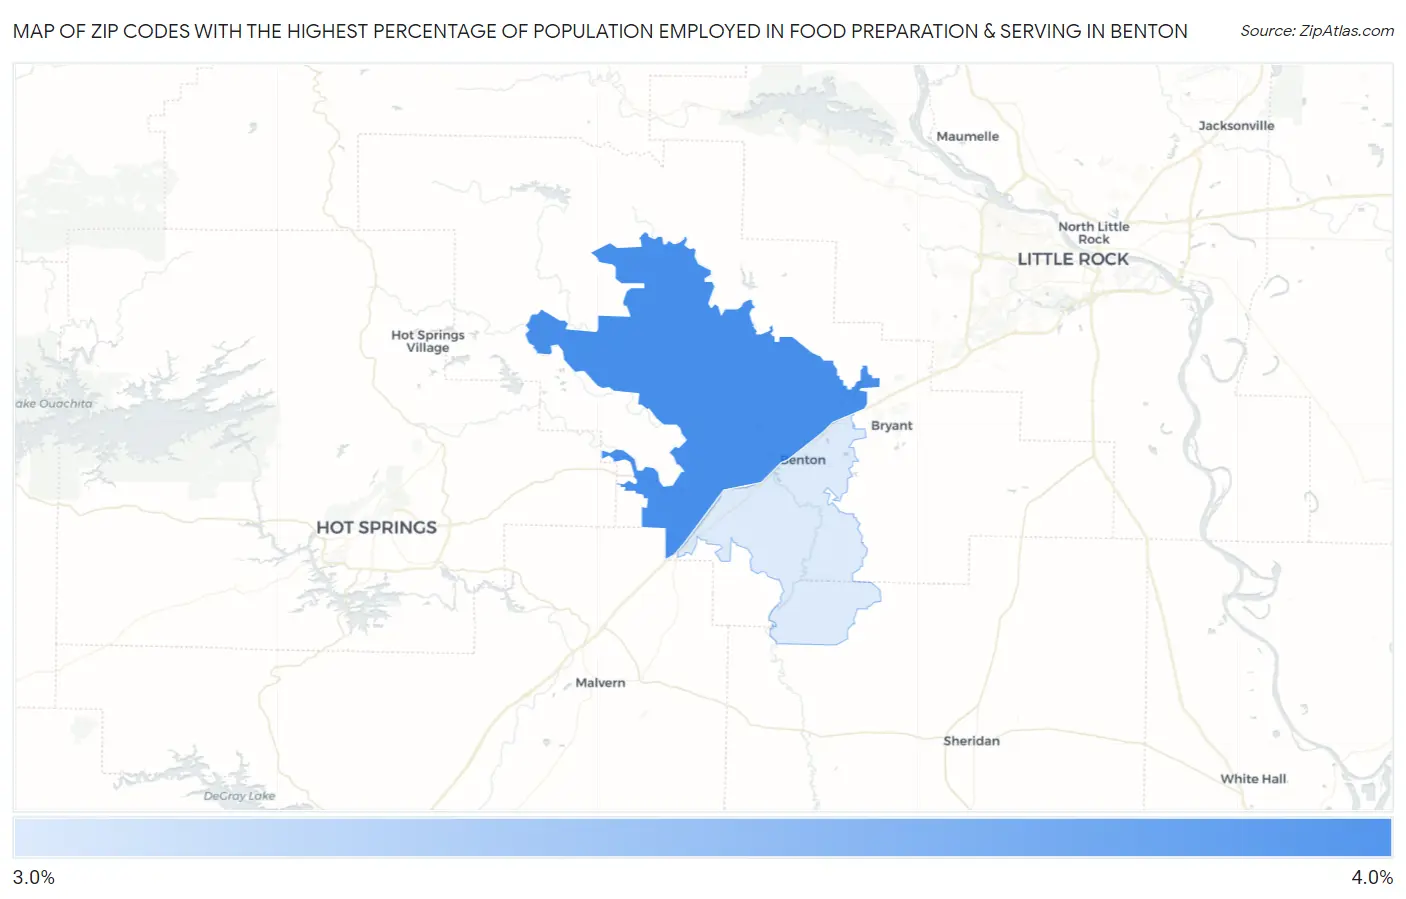
Map of Zip Codes with the Highest Percentage of Population Employed in Food Preparation & Serving in Benton
0.0%
4.0%
Zip Codes with the Highest Percentage of Population Employed in Food Preparation & Serving in Benton, AR
| Zip Code | % Employed | vs State | vs National | |
| 1. | 72019 | 4.0% | 5.4%(-1.41)#270 | 5.3%(-1.33)#17,322 |
| 2. | 72015 | 3.9% | 5.4%(-1.47)#275 | 5.3%(-1.40)#17,594 |
1
Common Questions
What are the Top Zip Codes with the Highest Percentage of Population Employed in Food Preparation & Serving in Benton, AR?
Top Zip Codes with the Highest Percentage of Population Employed in Food Preparation & Serving in Benton, AR are:
What zip code has the Highest Percentage of Population Employed in Food Preparation & Serving in Benton, AR?
72019 has the Highest Percentage of Population Employed in Food Preparation & Serving in Benton, AR with 4.0%.
What is the Percentage of Population Employed in Food Preparation & Serving in Benton, AR?
Percentage of Population Employed in Food Preparation & Serving in Benton is 3.4%.
What is the Percentage of Population Employed in Food Preparation & Serving in Arkansas?
Percentage of Population Employed in Food Preparation & Serving in Arkansas is 5.4%.
What is the Percentage of Population Employed in Food Preparation & Serving in the United States?
Percentage of Population Employed in Food Preparation & Serving in the United States is 5.3%.