Zip Codes with the Highest Percentage of Population Employed in Food Preparation & Serving in Springdale, AR
RELATED REPORTS & OPTIONS
Food Preparation & Serving
Springdale
Compare Zip Codes
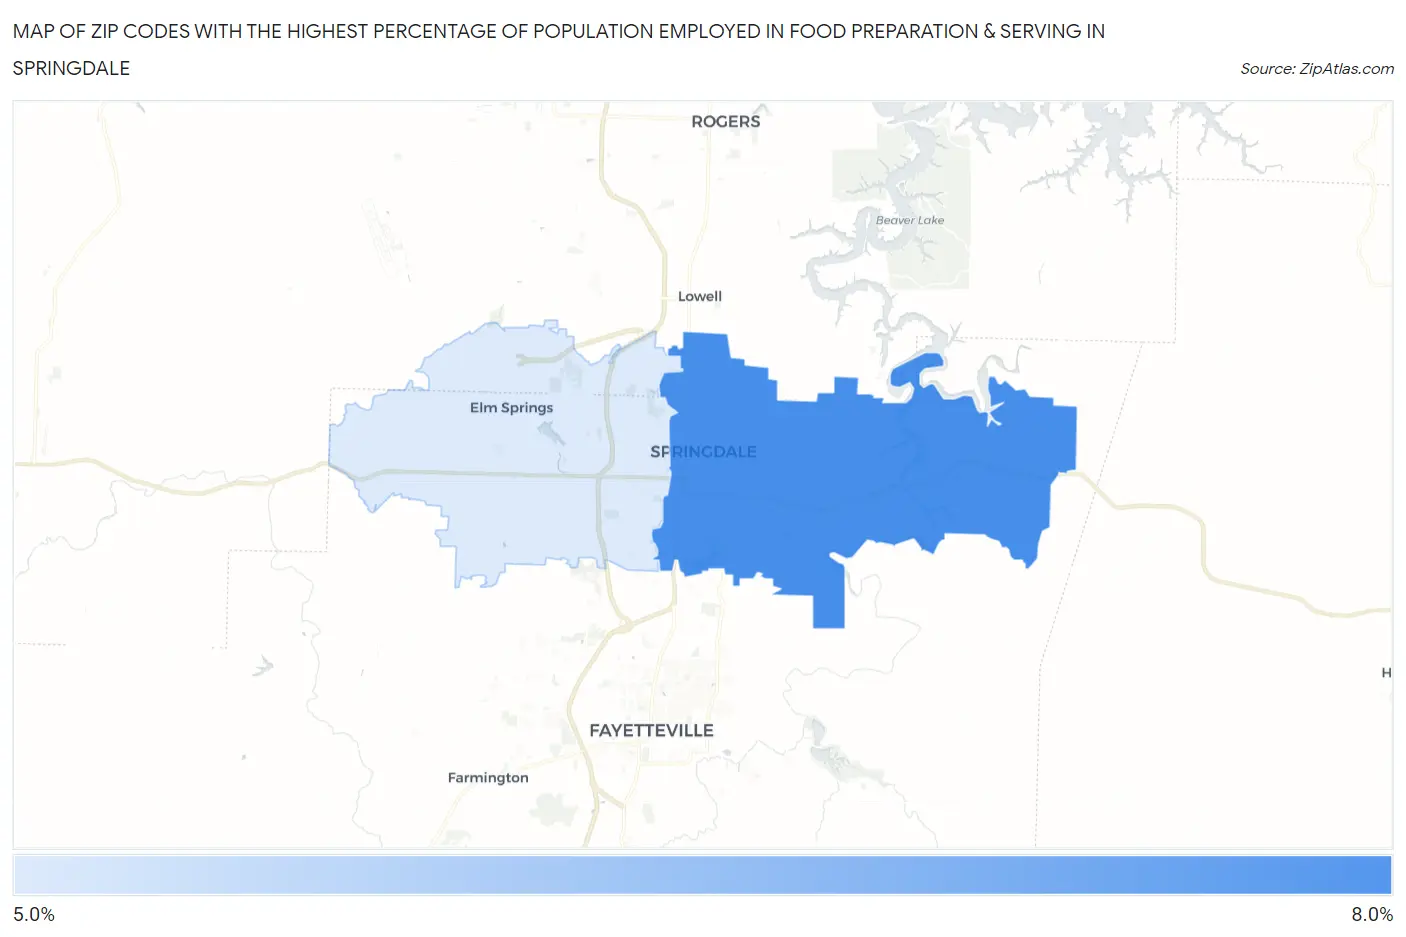
Map of Zip Codes with the Highest Percentage of Population Employed in Food Preparation & Serving in Springdale
0.0%
8.0%
Zip Codes with the Highest Percentage of Population Employed in Food Preparation & Serving in Springdale, AR
| Zip Code | % Employed | vs State | vs National | |
| 1. | 72764 | 6.7% | 5.4%(+1.35)#150 | 5.3%(+1.42)#7,324 |
| 2. | 72762 | 5.9% | 5.4%(+0.527)#173 | 5.3%(+0.600)#9,731 |
1
Common Questions
What are the Top Zip Codes with the Highest Percentage of Population Employed in Food Preparation & Serving in Springdale, AR?
Top Zip Codes with the Highest Percentage of Population Employed in Food Preparation & Serving in Springdale, AR are:
What zip code has the Highest Percentage of Population Employed in Food Preparation & Serving in Springdale, AR?
72764 has the Highest Percentage of Population Employed in Food Preparation & Serving in Springdale, AR with 6.7%.
What is the Percentage of Population Employed in Food Preparation & Serving in Springdale, AR?
Percentage of Population Employed in Food Preparation & Serving in Springdale is 6.7%.
What is the Percentage of Population Employed in Food Preparation & Serving in Arkansas?
Percentage of Population Employed in Food Preparation & Serving in Arkansas is 5.4%.
What is the Percentage of Population Employed in Food Preparation & Serving in the United States?
Percentage of Population Employed in Food Preparation & Serving in the United States is 5.3%.