Zip Codes with the Highest Percentage of Population Employed in Food Preparation & Serving in Russellville, AR
RELATED REPORTS & OPTIONS
Food Preparation & Serving
Russellville
Compare Zip Codes
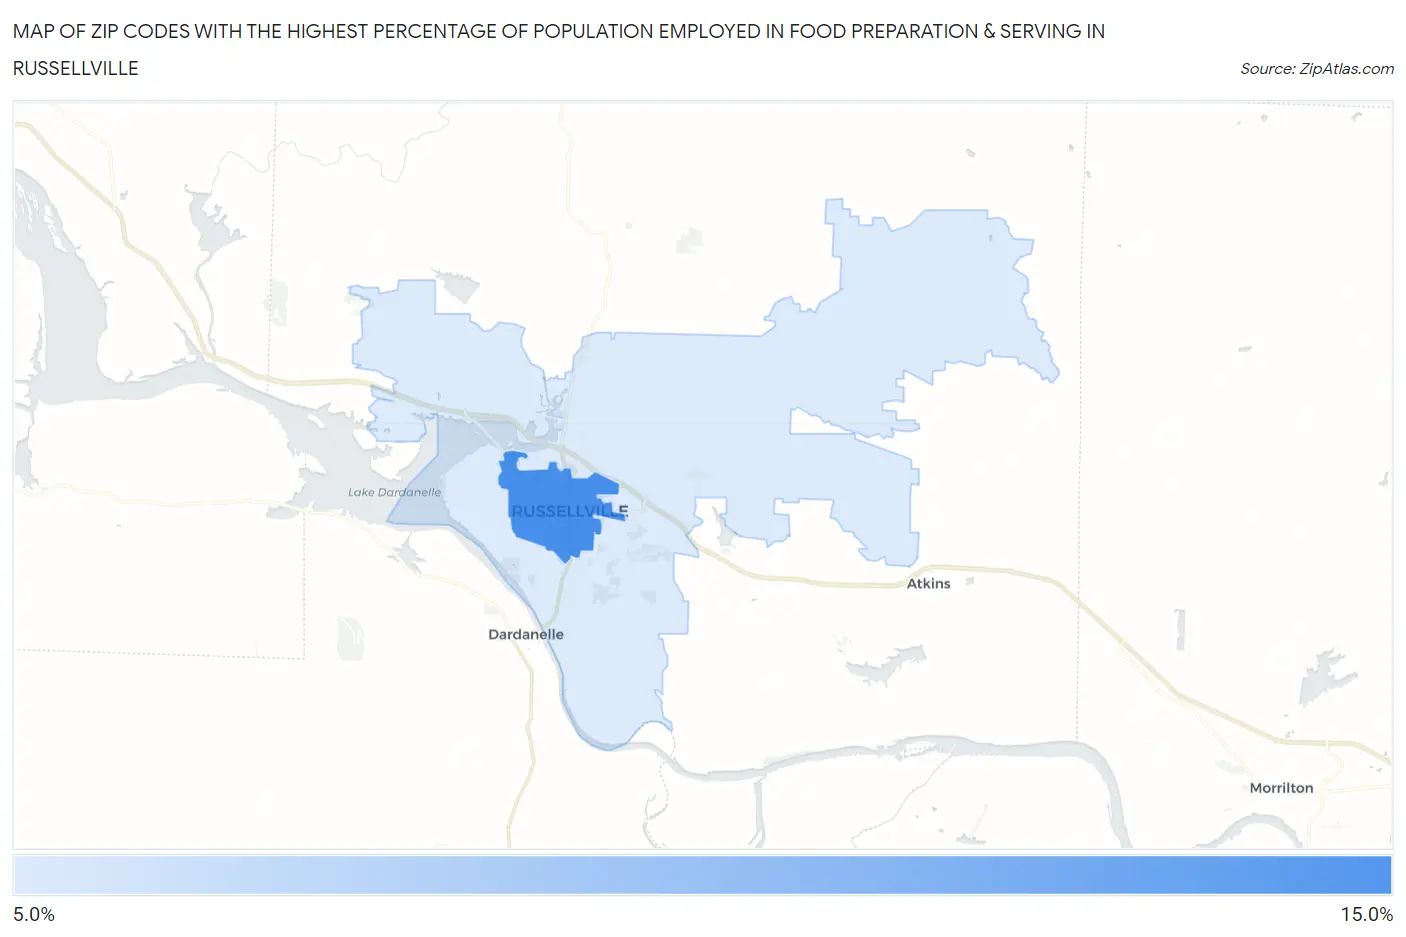
Map of Zip Codes with the Highest Percentage of Population Employed in Food Preparation & Serving in Russellville
0.0%
15.0%
Zip Codes with the Highest Percentage of Population Employed in Food Preparation & Serving in Russellville, AR
| Zip Code | % Employed | vs State | vs National | |
| 1. | 72801 | 12.5% | 5.4%(+7.16)#35 | 5.3%(+7.23)#1,508 |
| 2. | 72802 | 6.4% | 5.4%(+1.05)#156 | 5.3%(+1.13)#8,114 |
1
Common Questions
What are the Top Zip Codes with the Highest Percentage of Population Employed in Food Preparation & Serving in Russellville, AR?
Top Zip Codes with the Highest Percentage of Population Employed in Food Preparation & Serving in Russellville, AR are:
What zip code has the Highest Percentage of Population Employed in Food Preparation & Serving in Russellville, AR?
72801 has the Highest Percentage of Population Employed in Food Preparation & Serving in Russellville, AR with 12.5%.
What is the Percentage of Population Employed in Food Preparation & Serving in Russellville, AR?
Percentage of Population Employed in Food Preparation & Serving in Russellville is 10.4%.
What is the Percentage of Population Employed in Food Preparation & Serving in Arkansas?
Percentage of Population Employed in Food Preparation & Serving in Arkansas is 5.4%.
What is the Percentage of Population Employed in Food Preparation & Serving in the United States?
Percentage of Population Employed in Food Preparation & Serving in the United States is 5.3%.