Zip Codes with the Highest Percentage of Population Employed in Life, Physical & Social Science in Benton, AR
RELATED REPORTS & OPTIONS
Life, Physical & Social Science
Benton
Compare Zip Codes
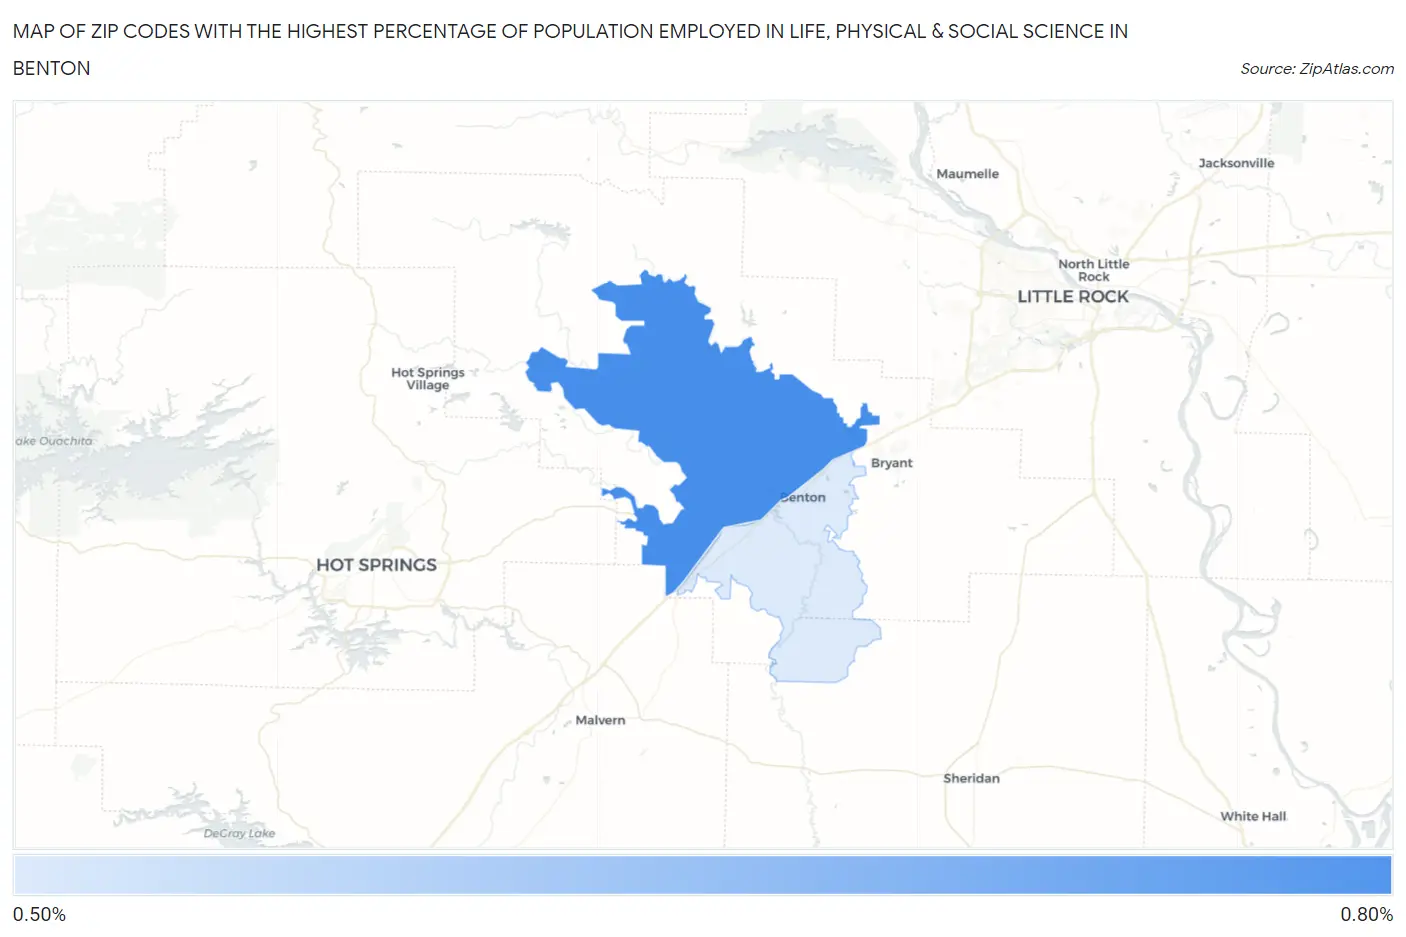
Map of Zip Codes with the Highest Percentage of Population Employed in Life, Physical & Social Science in Benton
0.0%
0.80%
Zip Codes with the Highest Percentage of Population Employed in Life, Physical & Social Science in Benton, AR
| Zip Code | % Employed | vs State | vs National | |
| 1. | 72019 | 0.69% | 0.65%(+0.034)#108 | 1.1%(-0.403)#12,192 |
| 2. | 72015 | 0.56% | 0.65%(-0.094)#127 | 1.1%(-0.531)#13,774 |
1
Common Questions
What are the Top Zip Codes with the Highest Percentage of Population Employed in Life, Physical & Social Science in Benton, AR?
Top Zip Codes with the Highest Percentage of Population Employed in Life, Physical & Social Science in Benton, AR are:
What zip code has the Highest Percentage of Population Employed in Life, Physical & Social Science in Benton, AR?
72019 has the Highest Percentage of Population Employed in Life, Physical & Social Science in Benton, AR with 0.69%.
What is the Percentage of Population Employed in Life, Physical & Social Science in Benton, AR?
Percentage of Population Employed in Life, Physical & Social Science in Benton is 0.65%.
What is the Percentage of Population Employed in Life, Physical & Social Science in Arkansas?
Percentage of Population Employed in Life, Physical & Social Science in Arkansas is 0.65%.
What is the Percentage of Population Employed in Life, Physical & Social Science in the United States?
Percentage of Population Employed in Life, Physical & Social Science in the United States is 1.1%.