Zip Codes with the Highest Percentage of Population Employed in Food Preparation & Serving in Pine Bluff, AR
RELATED REPORTS & OPTIONS
Food Preparation & Serving
Pine Bluff
Compare Zip Codes
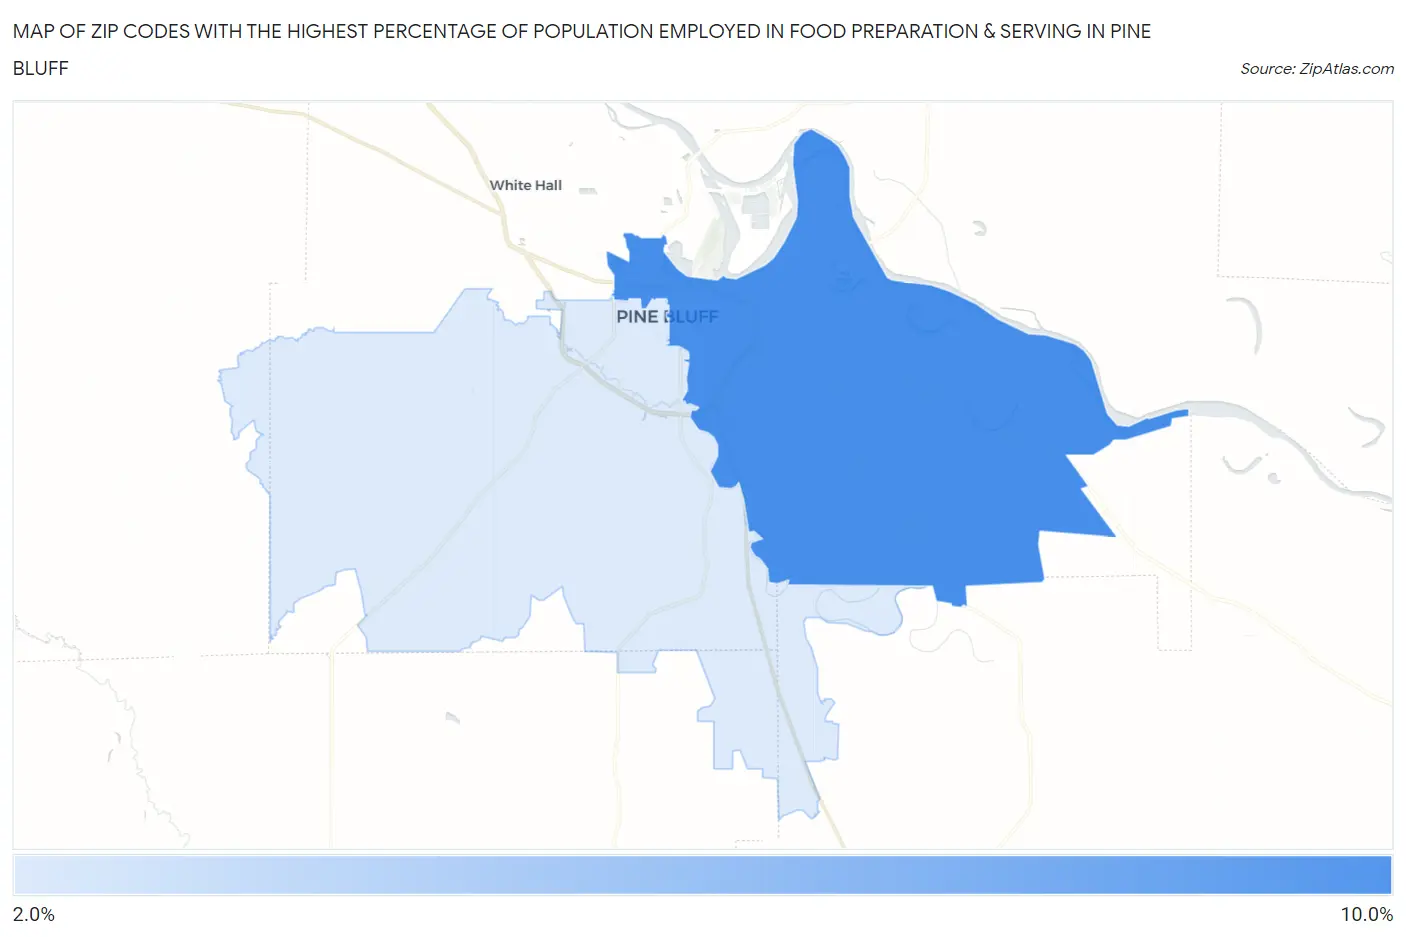
Map of Zip Codes with the Highest Percentage of Population Employed in Food Preparation & Serving in Pine Bluff
0.0%
10.0%
Zip Codes with the Highest Percentage of Population Employed in Food Preparation & Serving in Pine Bluff, AR
| Zip Code | % Employed | vs State | vs National | |
| 1. | 71601 | 8.2% | 5.4%(+2.83)#97 | 5.3%(+2.90)#4,453 |
| 2. | 71603 | 2.2% | 5.4%(-3.17)#365 | 5.3%(-3.10)#24,143 |
1
Common Questions
What are the Top Zip Codes with the Highest Percentage of Population Employed in Food Preparation & Serving in Pine Bluff, AR?
Top Zip Codes with the Highest Percentage of Population Employed in Food Preparation & Serving in Pine Bluff, AR are:
What zip code has the Highest Percentage of Population Employed in Food Preparation & Serving in Pine Bluff, AR?
71601 has the Highest Percentage of Population Employed in Food Preparation & Serving in Pine Bluff, AR with 8.2%.
What is the Percentage of Population Employed in Food Preparation & Serving in Pine Bluff, AR?
Percentage of Population Employed in Food Preparation & Serving in Pine Bluff is 5.8%.
What is the Percentage of Population Employed in Food Preparation & Serving in Arkansas?
Percentage of Population Employed in Food Preparation & Serving in Arkansas is 5.4%.
What is the Percentage of Population Employed in Food Preparation & Serving in the United States?
Percentage of Population Employed in Food Preparation & Serving in the United States is 5.3%.