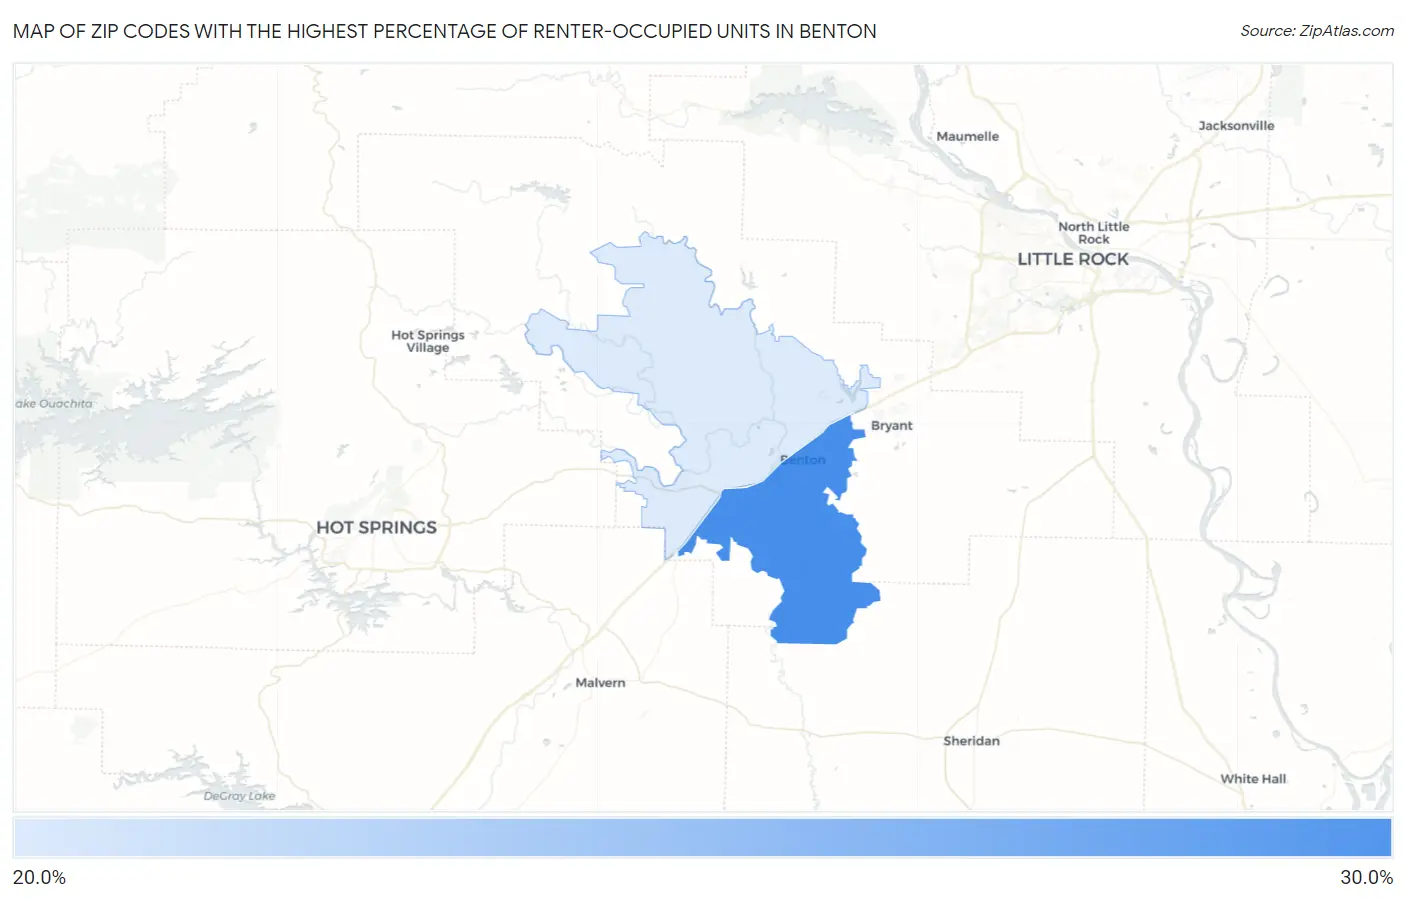
Zip Codes with the Highest Percentage of Renter-Occupied Units in Benton, AR
RELATED REPORTS & OPTIONS
Highest Renter-Occupied
Benton
Compare Zip Codes
Map of Zip Codes with the Highest Percentage of Renter-Occupied Units in Benton
0.0%
30.0%
Zip Codes with the Highest Percentage of Renter-Occupied Units in Benton, AR
| Zip Code | % Renter-Occupied | vs State | vs National | |
| 1. | 72015 | 29.7% | 33.8%(-4.03)#191 | 35.2%(-5.43)#10,248 |
| 2. | 72019 | 23.4% | 33.8%(-10.3)#283 | 35.2%(-11.7)#15,018 |
1
Common Questions
What are the Top Zip Codes with the Highest Percentage of Renter-Occupied Units in Benton, AR?
Top Zip Codes with the Highest Percentage of Renter-Occupied Units in Benton, AR are:
What zip code has the Highest Percentage of Renter-Occupied Units in Benton, AR?
72015 has the Highest Percentage of Renter-Occupied Units in Benton, AR with 29.7%.
What is the Percentage of Renter-Occupied Units in Benton, AR?
Percentage of Renter-Occupied Units in Benton is 34.1%.
What is the Percentage of Renter-Occupied Units in Arkansas?
Percentage of Renter-Occupied Units in Arkansas is 33.8%.
What is the Percentage of Renter-Occupied Units in the United States?
Percentage of Renter-Occupied Units in the United States is 35.2%.