Zip Codes with the Highest Percentage of Population Employed in Food Preparation & Serving in Selma, AL
RELATED REPORTS & OPTIONS
Food Preparation & Serving
Selma
Compare Zip Codes
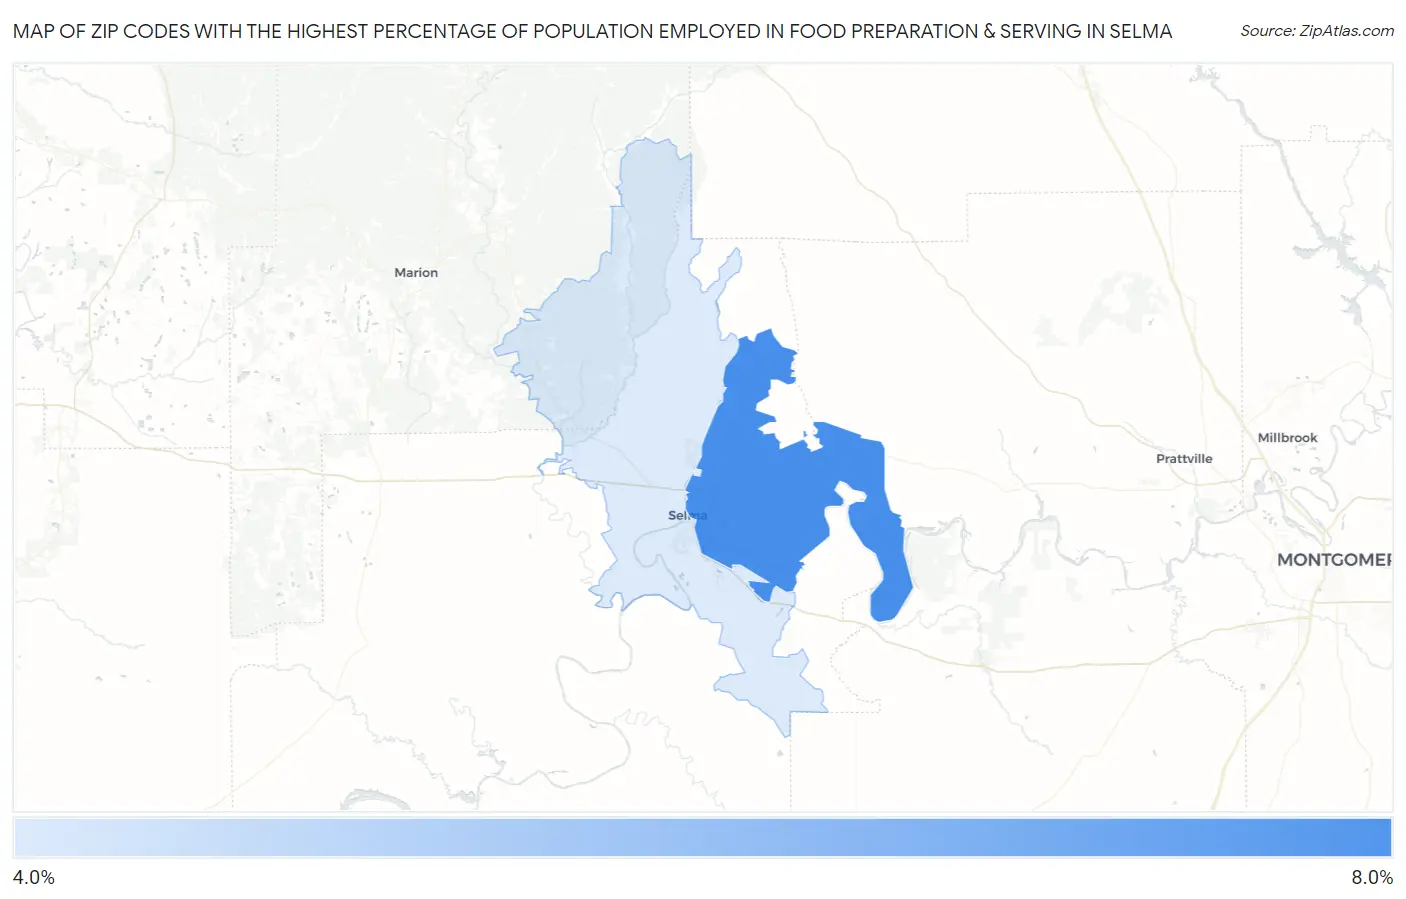
Map of Zip Codes with the Highest Percentage of Population Employed in Food Preparation & Serving in Selma
0.0%
8.0%
Zip Codes with the Highest Percentage of Population Employed in Food Preparation & Serving in Selma, AL
| Zip Code | % Employed | vs State | vs National | |
| 1. | 36703 | 7.3% | 5.2%(+2.10)#120 | 5.3%(+2.02)#5,912 |
| 2. | 36701 | 4.8% | 5.2%(-0.374)#267 | 5.3%(-0.460)#13,657 |
1
Common Questions
What are the Top Zip Codes with the Highest Percentage of Population Employed in Food Preparation & Serving in Selma, AL?
Top Zip Codes with the Highest Percentage of Population Employed in Food Preparation & Serving in Selma, AL are:
What zip code has the Highest Percentage of Population Employed in Food Preparation & Serving in Selma, AL?
36703 has the Highest Percentage of Population Employed in Food Preparation & Serving in Selma, AL with 7.3%.
What is the Percentage of Population Employed in Food Preparation & Serving in Selma, AL?
Percentage of Population Employed in Food Preparation & Serving in Selma is 5.3%.
What is the Percentage of Population Employed in Food Preparation & Serving in Alabama?
Percentage of Population Employed in Food Preparation & Serving in Alabama is 5.2%.
What is the Percentage of Population Employed in Food Preparation & Serving in the United States?
Percentage of Population Employed in Food Preparation & Serving in the United States is 5.3%.