Zip Codes with the Highest Percentage of Population Employed in Food Preparation & Serving in Madison, AL
RELATED REPORTS & OPTIONS
Food Preparation & Serving
Madison
Compare Zip Codes
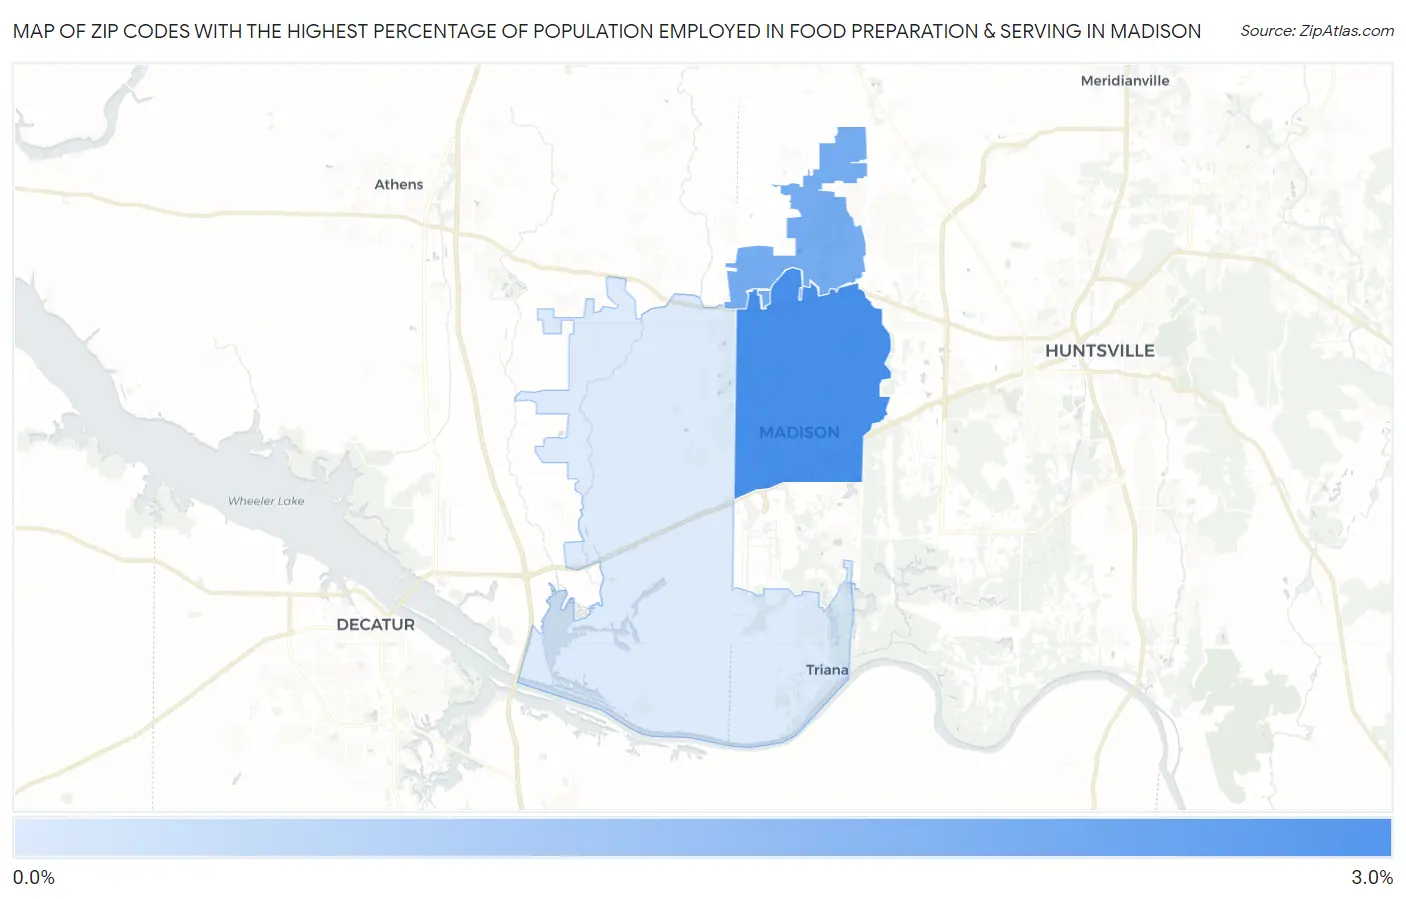
Map of Zip Codes with the Highest Percentage of Population Employed in Food Preparation & Serving in Madison
0.0%
3.0%
Zip Codes with the Highest Percentage of Population Employed in Food Preparation & Serving in Madison, AL
| Zip Code | % Employed | vs State | vs National | |
| 1. | 35758 | 2.9% | 5.2%(-2.34)#403 | 5.3%(-2.42)#21,797 |
| 2. | 35757 | 2.3% | 5.2%(-2.91)#431 | 5.3%(-3.00)#23,812 |
| 3. | 35756 | 0.98% | 5.2%(-4.22)#512 | 5.3%(-4.31)#27,017 |
1
Common Questions
What are the Top Zip Codes with the Highest Percentage of Population Employed in Food Preparation & Serving in Madison, AL?
Top Zip Codes with the Highest Percentage of Population Employed in Food Preparation & Serving in Madison, AL are:
What zip code has the Highest Percentage of Population Employed in Food Preparation & Serving in Madison, AL?
35758 has the Highest Percentage of Population Employed in Food Preparation & Serving in Madison, AL with 2.9%.
What is the Percentage of Population Employed in Food Preparation & Serving in Madison, AL?
Percentage of Population Employed in Food Preparation & Serving in Madison is 2.4%.
What is the Percentage of Population Employed in Food Preparation & Serving in Alabama?
Percentage of Population Employed in Food Preparation & Serving in Alabama is 5.2%.
What is the Percentage of Population Employed in Food Preparation & Serving in the United States?
Percentage of Population Employed in Food Preparation & Serving in the United States is 5.3%.