Zip Codes with the Highest Percentage of Population Employed in Food Preparation & Serving in Jasper, AL
RELATED REPORTS & OPTIONS
Food Preparation & Serving
Jasper
Compare Zip Codes
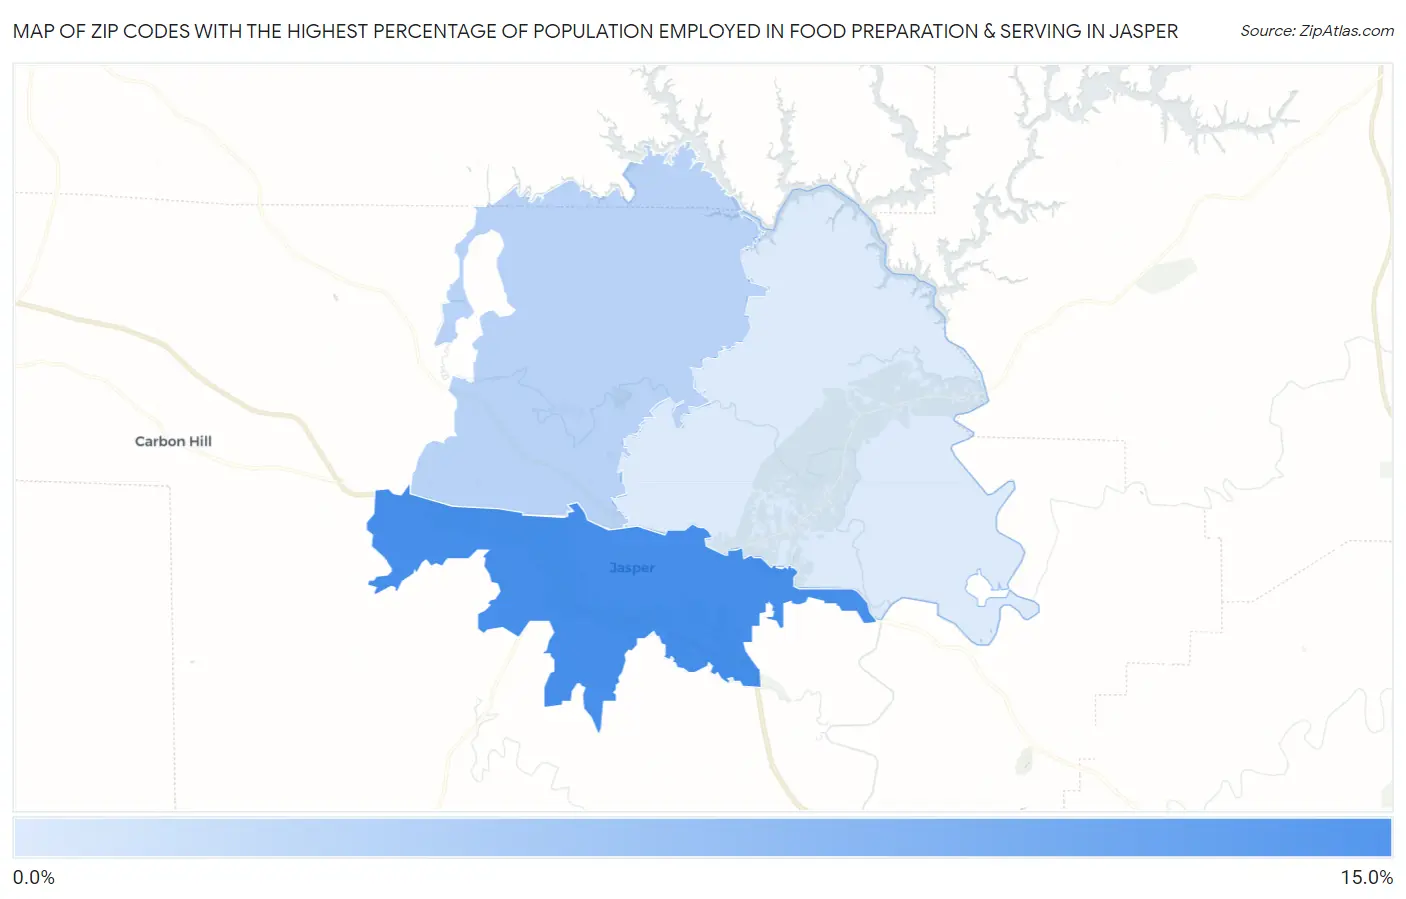
Map of Zip Codes with the Highest Percentage of Population Employed in Food Preparation & Serving in Jasper
0.0%
15.0%
Zip Codes with the Highest Percentage of Population Employed in Food Preparation & Serving in Jasper, AL
| Zip Code | % Employed | vs State | vs National | |
| 1. | 35501 | 10.6% | 5.2%(+5.42)#41 | 5.3%(+5.33)#2,253 |
| 2. | 35503 | 4.8% | 5.2%(-0.372)#266 | 5.3%(-0.458)#13,644 |
| 3. | 35504 | 3.0% | 5.2%(-2.16)#387 | 5.3%(-2.25)#21,098 |
1
Common Questions
What are the Top Zip Codes with the Highest Percentage of Population Employed in Food Preparation & Serving in Jasper, AL?
Top Zip Codes with the Highest Percentage of Population Employed in Food Preparation & Serving in Jasper, AL are:
What zip code has the Highest Percentage of Population Employed in Food Preparation & Serving in Jasper, AL?
35501 has the Highest Percentage of Population Employed in Food Preparation & Serving in Jasper, AL with 10.6%.
What is the Percentage of Population Employed in Food Preparation & Serving in Jasper, AL?
Percentage of Population Employed in Food Preparation & Serving in Jasper is 7.1%.
What is the Percentage of Population Employed in Food Preparation & Serving in Alabama?
Percentage of Population Employed in Food Preparation & Serving in Alabama is 5.2%.
What is the Percentage of Population Employed in Food Preparation & Serving in the United States?
Percentage of Population Employed in Food Preparation & Serving in the United States is 5.3%.