Zip Codes with the Highest Percentage of Population Employed in Food Preparation & Serving in Alabaster, AL
RELATED REPORTS & OPTIONS
Food Preparation & Serving
Alabaster
Compare Zip Codes
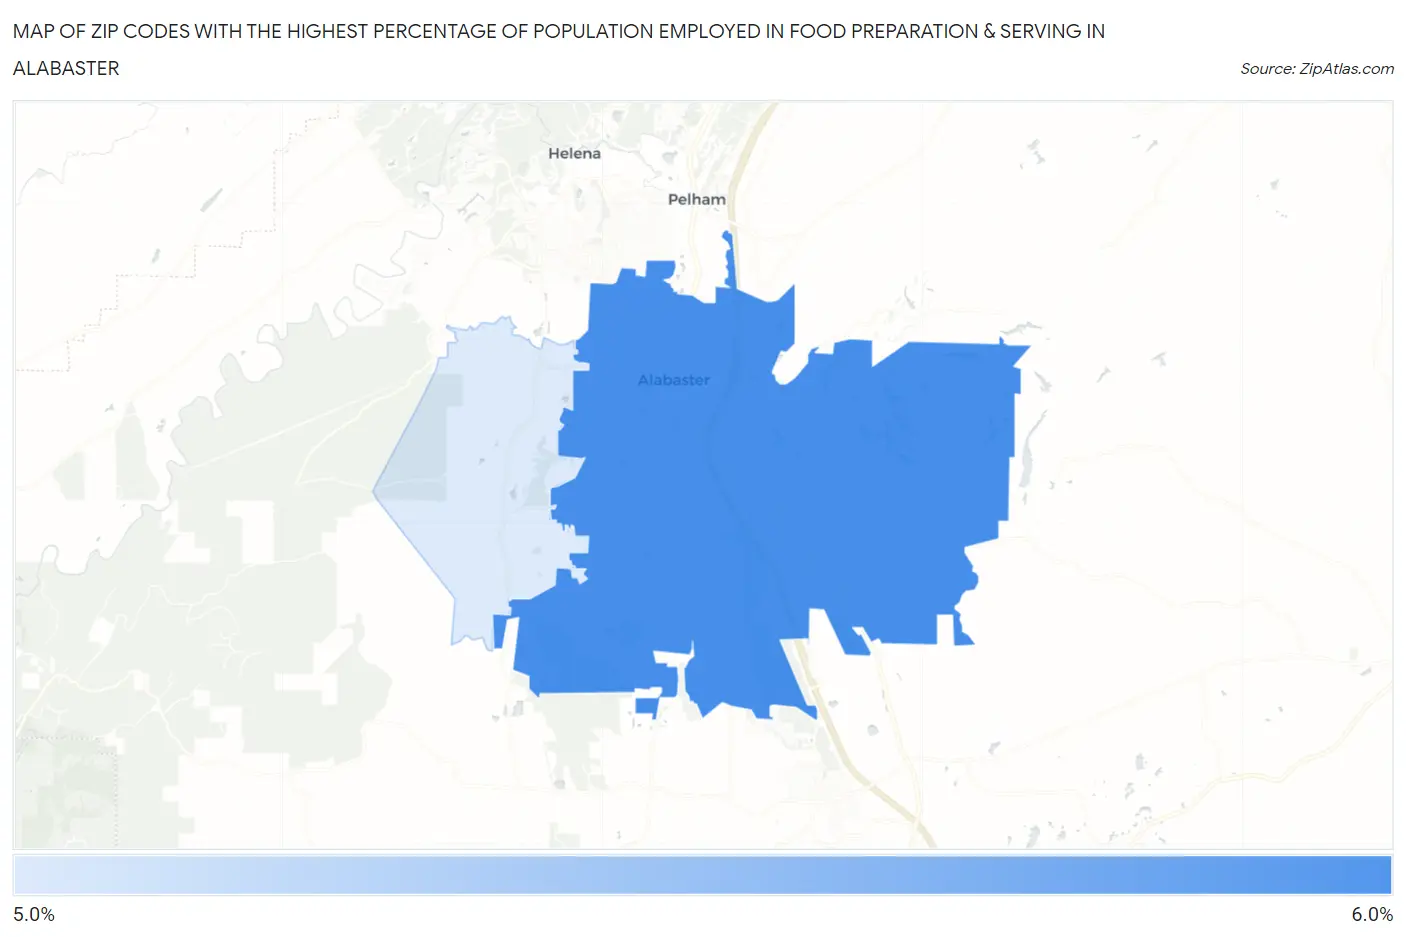
Map of Zip Codes with the Highest Percentage of Population Employed in Food Preparation & Serving in Alabaster
0.0%
6.0%
Zip Codes with the Highest Percentage of Population Employed in Food Preparation & Serving in Alabaster, AL
| Zip Code | % Employed | vs State | vs National | |
| 1. | 35007 | 5.6% | 5.2%(+0.360)#209 | 5.3%(+0.274)#10,844 |
| 2. | 35114 | 5.2% | 5.2%(-0.012)#235 | 5.3%(-0.097)#12,198 |
1
Common Questions
What are the Top Zip Codes with the Highest Percentage of Population Employed in Food Preparation & Serving in Alabaster, AL?
Top Zip Codes with the Highest Percentage of Population Employed in Food Preparation & Serving in Alabaster, AL are:
What zip code has the Highest Percentage of Population Employed in Food Preparation & Serving in Alabaster, AL?
35007 has the Highest Percentage of Population Employed in Food Preparation & Serving in Alabaster, AL with 5.6%.
What is the Percentage of Population Employed in Food Preparation & Serving in Alabaster, AL?
Percentage of Population Employed in Food Preparation & Serving in Alabaster is 5.6%.
What is the Percentage of Population Employed in Food Preparation & Serving in Alabama?
Percentage of Population Employed in Food Preparation & Serving in Alabama is 5.2%.
What is the Percentage of Population Employed in Food Preparation & Serving in the United States?
Percentage of Population Employed in Food Preparation & Serving in the United States is 5.3%.