Zip Codes with the Highest Percentage of Population Employed in Food Preparation & Serving in Fort Payne, AL
RELATED REPORTS & OPTIONS
Food Preparation & Serving
Fort Payne
Compare Zip Codes
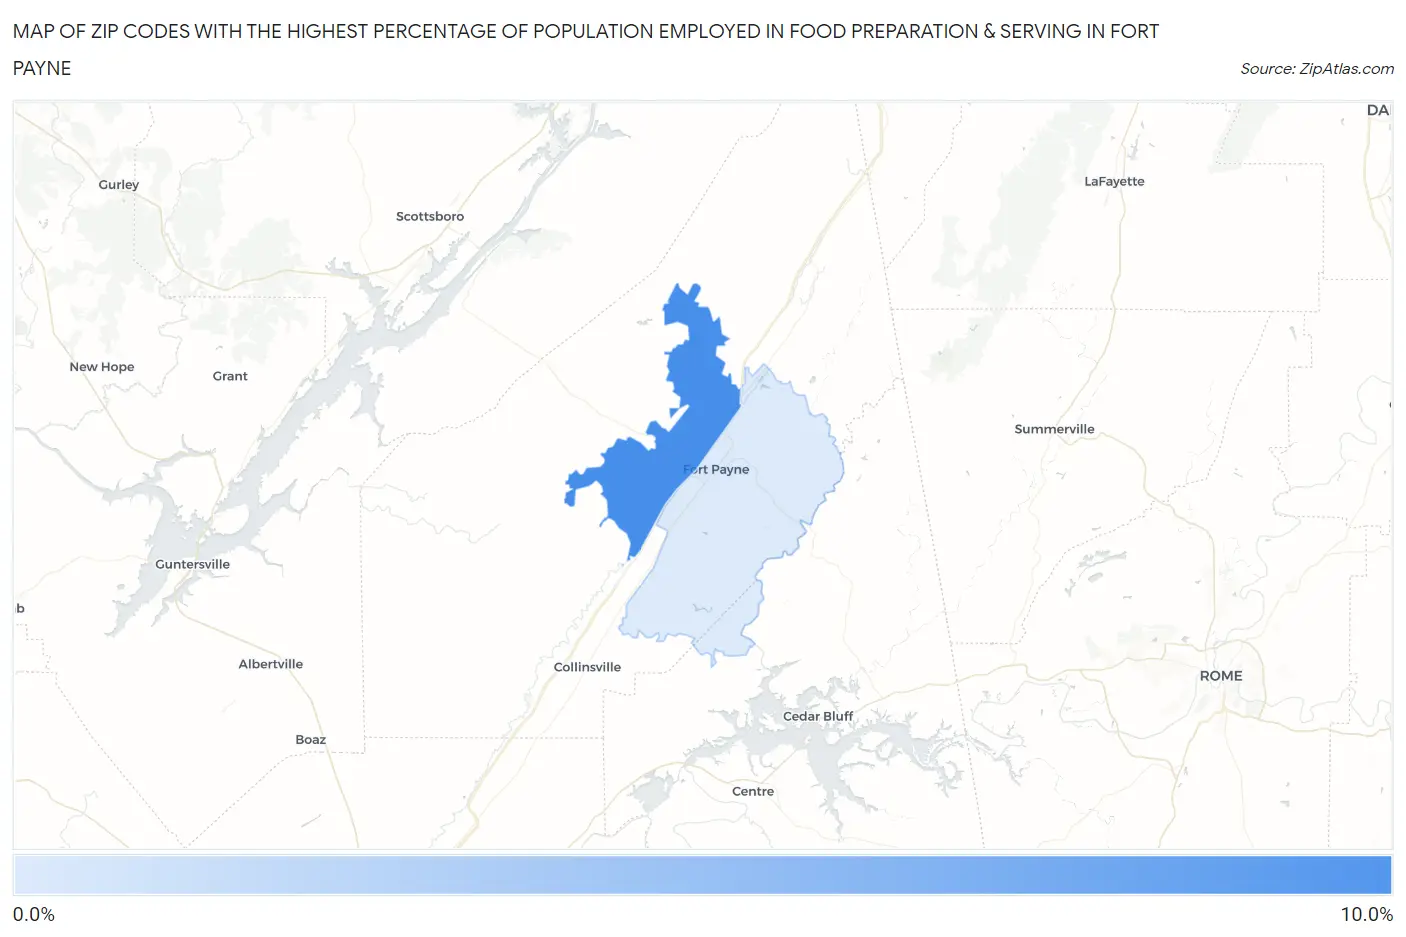
Map of Zip Codes with the Highest Percentage of Population Employed in Food Preparation & Serving in Fort Payne
0.0%
10.0%
Zip Codes with the Highest Percentage of Population Employed in Food Preparation & Serving in Fort Payne, AL
| Zip Code | % Employed | vs State | vs National | |
| 1. | 35968 | 9.1% | 5.2%(+3.90)#67 | 5.3%(+3.82)#3,409 |
| 2. | 35967 | 1.9% | 5.2%(-3.27)#458 | 5.3%(-3.35)#24,903 |
1
Common Questions
What are the Top Zip Codes with the Highest Percentage of Population Employed in Food Preparation & Serving in Fort Payne, AL?
Top Zip Codes with the Highest Percentage of Population Employed in Food Preparation & Serving in Fort Payne, AL are:
What zip code has the Highest Percentage of Population Employed in Food Preparation & Serving in Fort Payne, AL?
35968 has the Highest Percentage of Population Employed in Food Preparation & Serving in Fort Payne, AL with 9.1%.
What is the Percentage of Population Employed in Food Preparation & Serving in Fort Payne, AL?
Percentage of Population Employed in Food Preparation & Serving in Fort Payne is 2.1%.
What is the Percentage of Population Employed in Food Preparation & Serving in Alabama?
Percentage of Population Employed in Food Preparation & Serving in Alabama is 5.2%.
What is the Percentage of Population Employed in Food Preparation & Serving in the United States?
Percentage of Population Employed in Food Preparation & Serving in the United States is 5.3%.