Zip Codes with the Highest Percentage of Population Employed in Food Preparation & Serving in Florence, AL
RELATED REPORTS & OPTIONS
Food Preparation & Serving
Florence
Compare Zip Codes
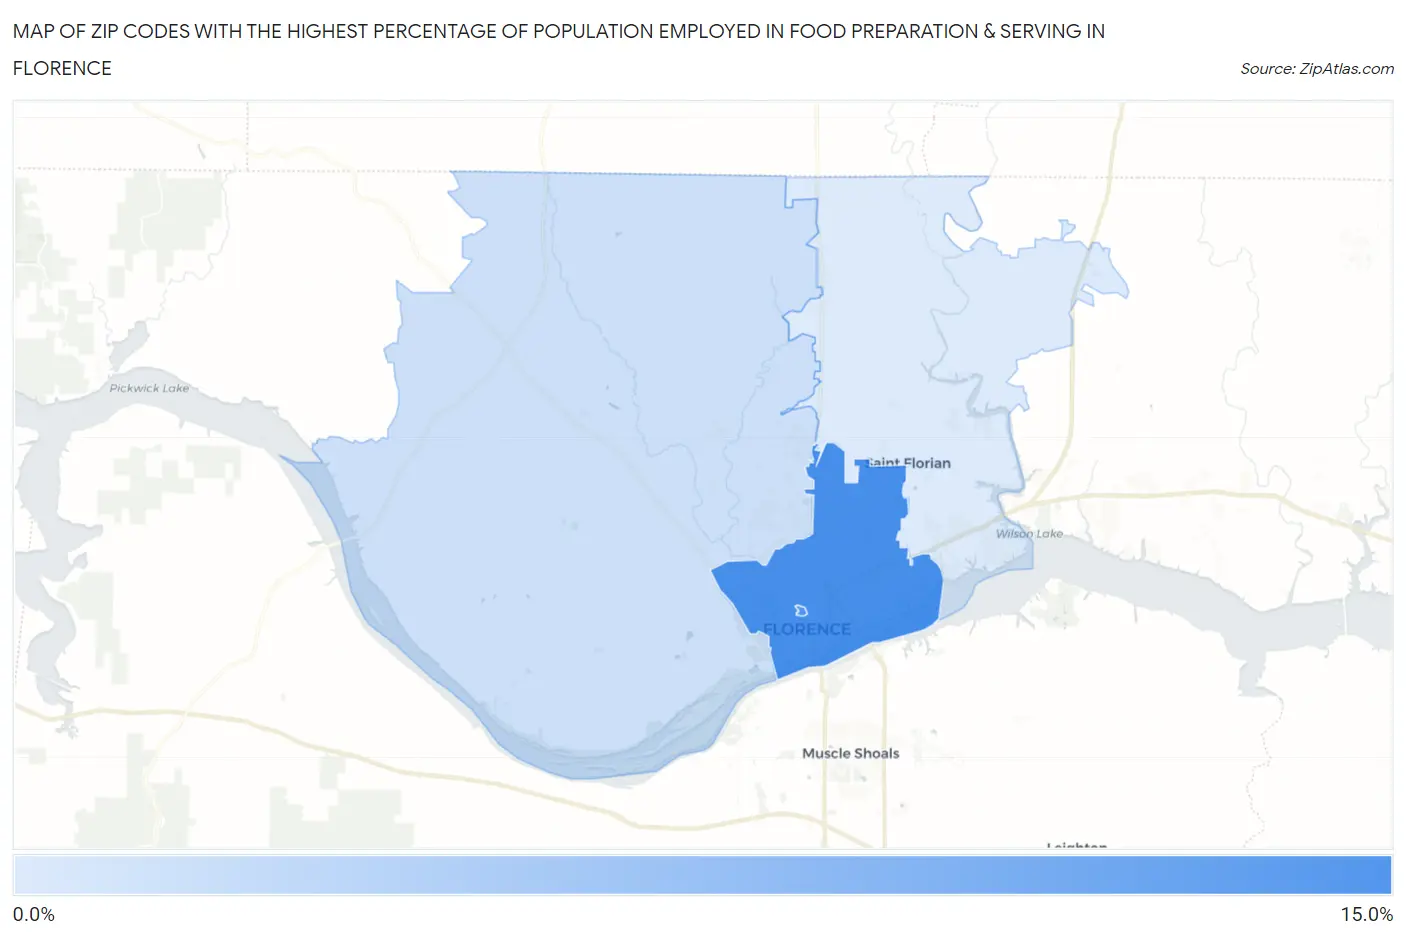
Map of Zip Codes with the Highest Percentage of Population Employed in Food Preparation & Serving in Florence
0.0%
15.0%
Zip Codes with the Highest Percentage of Population Employed in Food Preparation & Serving in Florence, AL
| Zip Code | % Employed | vs State | vs National | |
| 1. | 35630 | 10.1% | 5.2%(+4.93)#47 | 5.3%(+4.85)#2,538 |
| 2. | 35632 | 9.4% | 5.2%(+4.24)#58 | 5.3%(+4.15)#3,102 |
| 3. | 35633 | 3.6% | 5.2%(-1.65)#350 | 5.3%(-1.73)#18,982 |
| 4. | 35634 | 2.8% | 5.2%(-2.40)#408 | 5.3%(-2.49)#22,071 |
1
Common Questions
What are the Top 3 Zip Codes with the Highest Percentage of Population Employed in Food Preparation & Serving in Florence, AL?
Top 3 Zip Codes with the Highest Percentage of Population Employed in Food Preparation & Serving in Florence, AL are:
What zip code has the Highest Percentage of Population Employed in Food Preparation & Serving in Florence, AL?
35630 has the Highest Percentage of Population Employed in Food Preparation & Serving in Florence, AL with 10.1%.
What is the Percentage of Population Employed in Food Preparation & Serving in Florence, AL?
Percentage of Population Employed in Food Preparation & Serving in Florence is 8.8%.
What is the Percentage of Population Employed in Food Preparation & Serving in Alabama?
Percentage of Population Employed in Food Preparation & Serving in Alabama is 5.2%.
What is the Percentage of Population Employed in Food Preparation & Serving in the United States?
Percentage of Population Employed in Food Preparation & Serving in the United States is 5.3%.