Zip Codes with the Highest Percentage of Population Employed in Real Estate, Rental & Leasing in Woodinville, WA
RELATED REPORTS & OPTIONS
Real Estate, Rental & Leasing
Woodinville
Compare Zip Codes
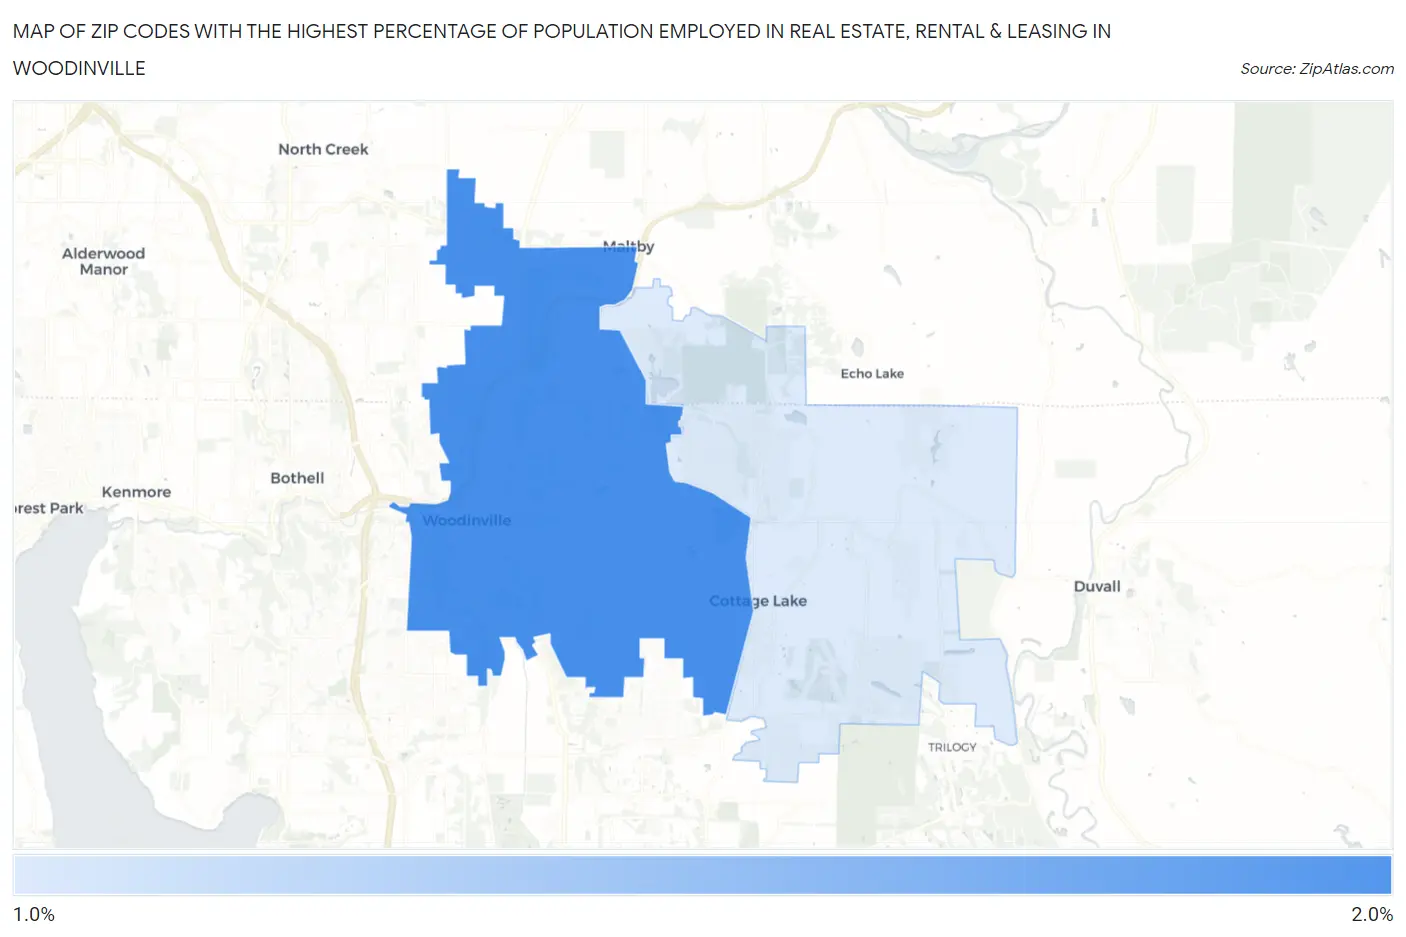
Map of Zip Codes with the Highest Percentage of Population Employed in Real Estate, Rental & Leasing in Woodinville
0.0%
2.0%
Zip Codes with the Highest Percentage of Population Employed in Real Estate, Rental & Leasing in Woodinville, WA
| Zip Code | % Employed | vs State | vs National | |
| 1. | 98072 | 1.9% | 2.1%(-0.195)#240 | 1.9%(+0.010)#8,454 |
| 2. | 98077 | 1.4% | 2.1%(-0.655)#304 | 1.9%(-0.450)#11,636 |
1
Common Questions
What are the Top Zip Codes with the Highest Percentage of Population Employed in Real Estate, Rental & Leasing in Woodinville, WA?
Top Zip Codes with the Highest Percentage of Population Employed in Real Estate, Rental & Leasing in Woodinville, WA are:
What zip code has the Highest Percentage of Population Employed in Real Estate, Rental & Leasing in Woodinville, WA?
98072 has the Highest Percentage of Population Employed in Real Estate, Rental & Leasing in Woodinville, WA with 1.9%.
What is the Percentage of Population Employed in Real Estate, Rental & Leasing in Woodinville, WA?
Percentage of Population Employed in Real Estate, Rental & Leasing in Woodinville is 2.0%.
What is the Percentage of Population Employed in Real Estate, Rental & Leasing in Washington?
Percentage of Population Employed in Real Estate, Rental & Leasing in Washington is 2.1%.
What is the Percentage of Population Employed in Real Estate, Rental & Leasing in the United States?
Percentage of Population Employed in Real Estate, Rental & Leasing in the United States is 1.9%.