Zip Codes with the Highest Percentage of Population Employed in Professional & Scientific Services in Woodinville, WA
RELATED REPORTS & OPTIONS
Professional & Scientific Services
Woodinville
Compare Zip Codes
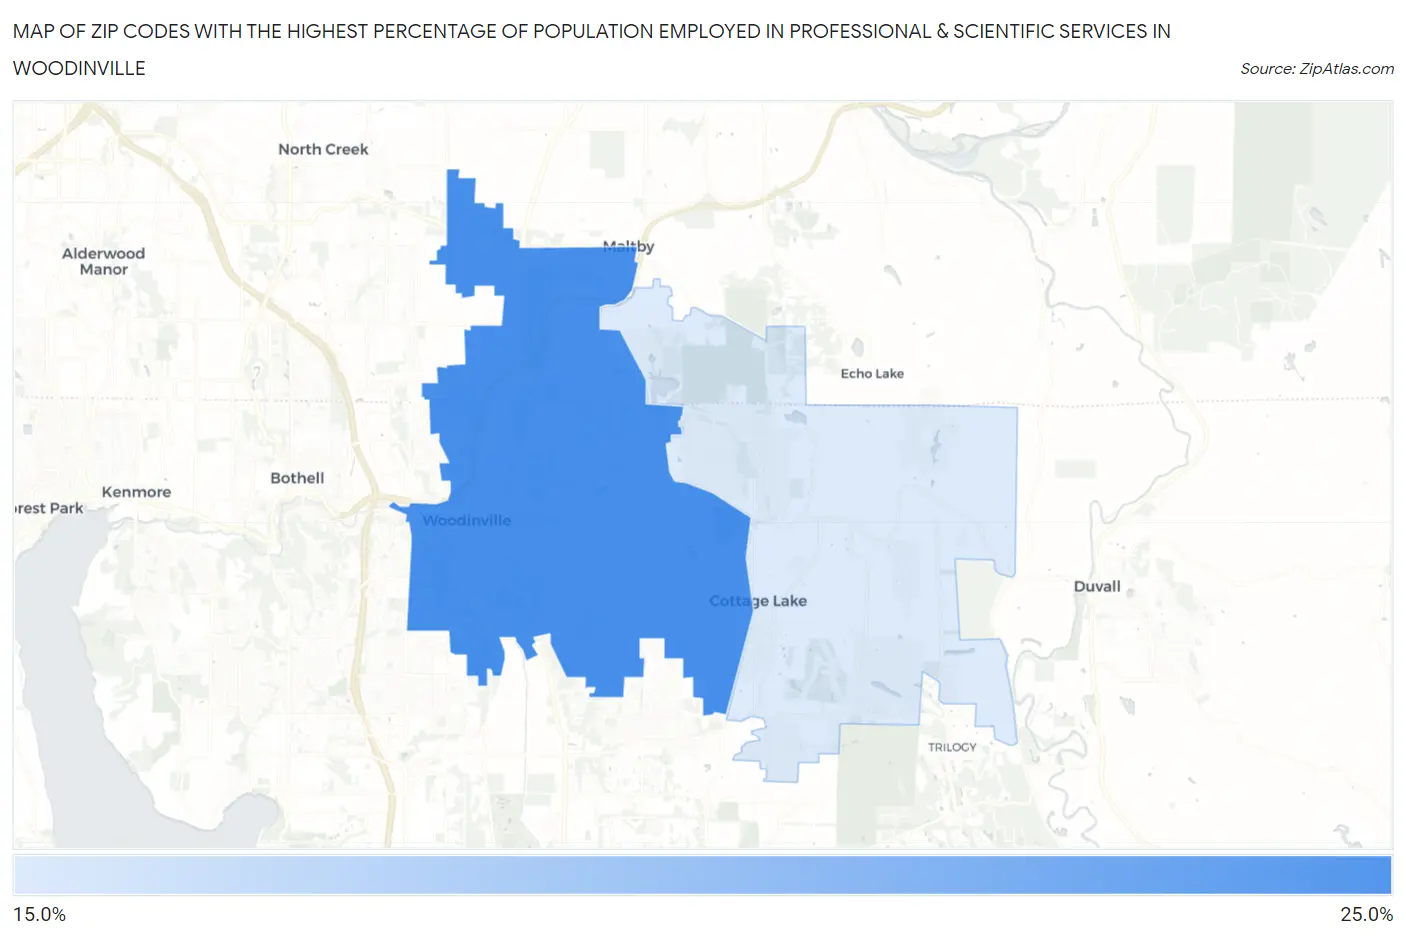
Map of Zip Codes with the Highest Percentage of Population Employed in Professional & Scientific Services in Woodinville
0.0%
25.0%
Zip Codes with the Highest Percentage of Population Employed in Professional & Scientific Services in Woodinville, WA
| Zip Code | % Employed | vs State | vs National | |
| 1. | 98072 | 22.2% | 10.3%(+11.9)#28 | 7.8%(+14.3)#648 |
| 2. | 98077 | 19.7% | 10.3%(+9.38)#37 | 7.8%(+11.9)#921 |
1
Common Questions
What are the Top Zip Codes with the Highest Percentage of Population Employed in Professional & Scientific Services in Woodinville, WA?
Top Zip Codes with the Highest Percentage of Population Employed in Professional & Scientific Services in Woodinville, WA are:
What zip code has the Highest Percentage of Population Employed in Professional & Scientific Services in Woodinville, WA?
98072 has the Highest Percentage of Population Employed in Professional & Scientific Services in Woodinville, WA with 22.2%.
What is the Percentage of Population Employed in Professional & Scientific Services in Woodinville, WA?
Percentage of Population Employed in Professional & Scientific Services in Woodinville is 22.9%.
What is the Percentage of Population Employed in Professional & Scientific Services in Washington?
Percentage of Population Employed in Professional & Scientific Services in Washington is 10.3%.
What is the Percentage of Population Employed in Professional & Scientific Services in the United States?
Percentage of Population Employed in Professional & Scientific Services in the United States is 7.8%.