Zip Codes with the Highest Percentage of Population Employed in Professional & Scientific Services in Kent, WA
RELATED REPORTS & OPTIONS
Professional & Scientific Services
Kent
Compare Zip Codes
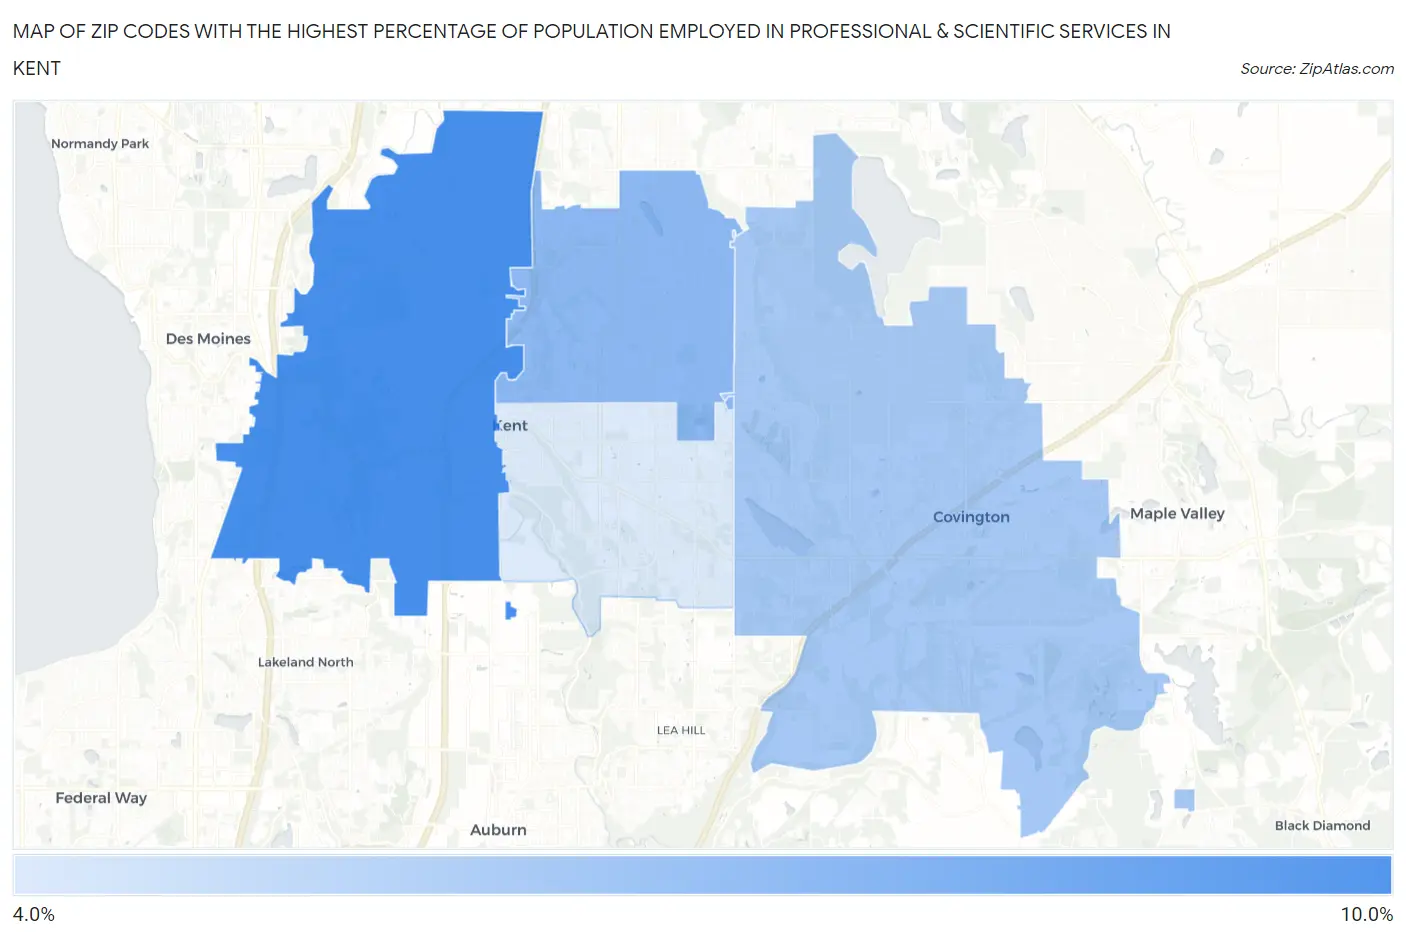
Map of Zip Codes with the Highest Percentage of Population Employed in Professional & Scientific Services in Kent
0.0%
10.0%
Zip Codes with the Highest Percentage of Population Employed in Professional & Scientific Services in Kent, WA
| Zip Code | % Employed | vs State | vs National | |
| 1. | 98032 | 8.4% | 10.3%(-1.94)#148 | 7.8%(+0.548)#6,140 |
| 2. | 98031 | 6.8% | 10.3%(-3.54)#206 | 7.8%(-1.06)#8,501 |
| 3. | 98042 | 6.2% | 10.3%(-4.17)#237 | 7.8%(-1.68)#9,662 |
| 4. | 98030 | 4.9% | 10.3%(-5.42)#299 | 7.8%(-2.94)#12,552 |
1
Common Questions
What are the Top 3 Zip Codes with the Highest Percentage of Population Employed in Professional & Scientific Services in Kent, WA?
Top 3 Zip Codes with the Highest Percentage of Population Employed in Professional & Scientific Services in Kent, WA are:
What zip code has the Highest Percentage of Population Employed in Professional & Scientific Services in Kent, WA?
98032 has the Highest Percentage of Population Employed in Professional & Scientific Services in Kent, WA with 8.4%.
What is the Percentage of Population Employed in Professional & Scientific Services in Kent, WA?
Percentage of Population Employed in Professional & Scientific Services in Kent is 7.1%.
What is the Percentage of Population Employed in Professional & Scientific Services in Washington?
Percentage of Population Employed in Professional & Scientific Services in Washington is 10.3%.
What is the Percentage of Population Employed in Professional & Scientific Services in the United States?
Percentage of Population Employed in Professional & Scientific Services in the United States is 7.8%.