Liberian vs Belgian 3 or more Vehicles in Household

COMPARE

Liberian
Race
Ancestry
AfghanAfricanAlaska NativeAlaskan AthabascanAlbanianAleutAlsatianAmericanApacheArabArapahoArgentineanArmenianAssyrian/Chaldean/SyriacAustralianAustrianBahamianBangladeshiBarbadianBasqueBelizeanBermudanBhutaneseBlackfeetBolivianBrazilianBritishBritish West IndianBulgarianBurmeseCajunCambodianCanadianCape VerdeanCarpatho RusynCelticCentral AmericanCentral American IndianCherokeeCheyenneChickasawChileanChineseChippewaChoctawColombianColvilleComancheCosta RicanCreeCreekCroatianCrowCubanCypriotCzechCzechoslovakianDanishDelawareDominicanDutchDutch West IndianEastern EuropeanEcuadorianEgyptianEnglishEstonianEthiopianEuropeanFijianFilipinoFinnishFrenchFrench American IndianFrench CanadianGermanGerman RussianGhanaianGreekGuamanian/ChamorroGuatemalanGuyaneseHaitianHmongHonduranHopiHoumaHungarianIcelanderIndian (Asian)IndonesianInupiatIranianIraqiIrishIroquoisIsraeliItalianJamaicanJapaneseJordanianKenyanKiowaKoreanLaotianLatvianLebaneseLiberianLithuanianLumbeeLuxembourgerMacedonianMalaysianMalteseMarshalleseMenomineeMexicanMexican American IndianMongolianMoroccanNative HawaiianNavajoNepaleseNew ZealanderNicaraguanNigerianNorthern EuropeanNorwegianOkinawanOsageOttawaPaiutePakistaniPalestinianPanamanianParaguayanPennsylvania GermanPeruvianPimaPolishPortuguesePotawatomiPuebloPuerto RicanPuget Sound SalishRomanianRussianSalvadoranSamoanScandinavianScotch-IrishScottishSeminoleSenegaleseSerbianShoshoneSierra LeoneanSiouxSlavicSlovakSloveneSomaliSouth AfricanSouth AmericanSouth American IndianSoviet UnionSpaniardSpanishSpanish AmericanSpanish American IndianSri LankanSubsaharan AfricanSudaneseSwedishSwissSyrianTaiwaneseThaiTlingit-HaidaTohono O'OdhamTonganTrinidadian and TobagonianTsimshianTurkishU.S. Virgin IslanderUgandanUkrainianUruguayanUteVenezuelanVietnameseWelshWest IndianYakamaYaquiYugoslavianYumanYup'ikZimbabwean
Immigration
NonimmigrantsImmigrantsAfghanistanAfricaAlbaniaArgentinaArmeniaAsiaAustraliaAustriaBahamasBangladeshBarbadosBelarusBelgiumBelizeBoliviaBosnia and HerzegovinaBrazilBulgariaBurma/MyanmarCabo VerdeCambodiaCameroonCanadaCaribbeanCentral AmericaChileChinaColombiaCongoCosta RicaCroatiaCubaCzechoslovakiaDenmarkDominicaDominican RepublicEastern AfricaEastern AsiaEastern EuropeEcuadorEgyptEl SalvadorEnglandEritreaEthiopiaEuropeFijiFranceGermanyGhanaGreeceGrenadaGuatemalaGuyanaHaitiHondurasHong KongHungaryIndiaIndonesiaIranIraqIrelandIsraelItalyJamaicaJapanJordanKazakhstanKenyaKoreaKuwaitLaosLatin AmericaLatviaLebanonLiberiaLithuaniaMalaysiaMexicoMicronesiaMiddle AfricaMoldovaMoroccoNepalNetherlandsNicaraguaNigeriaNorth AmericaNorth MacedoniaNorthern AfricaNorthern EuropeNorwayOceaniaPakistanPanamaPeruPhilippinesPolandPortugalRomaniaRussiaSaudi ArabiaScotlandSenegalSerbiaSierra LeoneSingaporeSomaliaSouth AfricaSouth AmericaSouth Central AsiaSouth Eastern AsiaSouthern EuropeSpainSri LankaSt. Vincent and the GrenadinesSudanSwedenSwitzerlandSyriaTaiwanThailandTrinidad and TobagoTurkeyUgandaUkraineUruguayUzbekistanVenezuelaVietnamWest IndiesWestern AfricaWestern AsiaWestern EuropeYemenZaireZimbabweAzores
Belgian
Race
Ancestry
AfghanAfricanAlaska NativeAlaskan AthabascanAlbanianAleutAlsatianAmericanApacheArabArapahoArgentineanArmenianAssyrian/Chaldean/SyriacAustralianAustrianBahamianBangladeshiBarbadianBasqueBelgianBelizeanBermudanBhutaneseBlackfeetBolivianBrazilianBritishBritish West IndianBulgarianBurmeseCajunCambodianCanadianCape VerdeanCarpatho RusynCelticCentral AmericanCentral American IndianCherokeeCheyenneChickasawChileanChineseChippewaChoctawColombianColvilleComancheCosta RicanCreeCreekCroatianCrowCubanCypriotCzechCzechoslovakianDanishDelawareDominicanDutchDutch West IndianEastern EuropeanEcuadorianEgyptianEnglishEstonianEthiopianEuropeanFijianFilipinoFinnishFrenchFrench American IndianFrench CanadianGermanGerman RussianGhanaianGreekGuamanian/ChamorroGuatemalanGuyaneseHaitianHmongHonduranHopiHoumaHungarianIcelanderIndian (Asian)IndonesianInupiatIranianIraqiIrishIroquoisIsraeliItalianJamaicanJapaneseJordanianKenyanKiowaKoreanLaotianLatvianLebaneseLithuanianLumbeeLuxembourgerMacedonianMalaysianMalteseMarshalleseMenomineeMexicanMexican American IndianMongolianMoroccanNative HawaiianNavajoNepaleseNew ZealanderNicaraguanNigerianNorthern EuropeanNorwegianOkinawanOsageOttawaPaiutePakistaniPalestinianPanamanianParaguayanPennsylvania GermanPeruvianPimaPolishPortuguesePotawatomiPuebloPuerto RicanPuget Sound SalishRomanianRussianSalvadoranSamoanScandinavianScotch-IrishScottishSeminoleSenegaleseSerbianShoshoneSierra LeoneanSiouxSlavicSlovakSloveneSomaliSouth AfricanSouth AmericanSouth American IndianSoviet UnionSpaniardSpanishSpanish AmericanSpanish American IndianSri LankanSubsaharan AfricanSudaneseSwedishSwissSyrianTaiwaneseThaiTlingit-HaidaTohono O'OdhamTonganTrinidadian and TobagonianTsimshianTurkishU.S. Virgin IslanderUgandanUkrainianUruguayanUteVenezuelanVietnameseWelshWest IndianYakamaYaquiYugoslavianYumanYup'ikZimbabwean
Immigration
NonimmigrantsImmigrantsAfghanistanAfricaAlbaniaArgentinaArmeniaAsiaAustraliaAustriaBahamasBangladeshBarbadosBelarusBelgiumBelizeBoliviaBosnia and HerzegovinaBrazilBulgariaBurma/MyanmarCabo VerdeCambodiaCameroonCanadaCaribbeanCentral AmericaChileChinaColombiaCongoCosta RicaCroatiaCubaCzechoslovakiaDenmarkDominicaDominican RepublicEastern AfricaEastern AsiaEastern EuropeEcuadorEgyptEl SalvadorEnglandEritreaEthiopiaEuropeFijiFranceGermanyGhanaGreeceGrenadaGuatemalaGuyanaHaitiHondurasHong KongHungaryIndiaIndonesiaIranIraqIrelandIsraelItalyJamaicaJapanJordanKazakhstanKenyaKoreaKuwaitLaosLatin AmericaLatviaLebanonLiberiaLithuaniaMalaysiaMexicoMicronesiaMiddle AfricaMoldovaMoroccoNepalNetherlandsNicaraguaNigeriaNorth AmericaNorth MacedoniaNorthern AfricaNorthern EuropeNorwayOceaniaPakistanPanamaPeruPhilippinesPolandPortugalRomaniaRussiaSaudi ArabiaScotlandSenegalSerbiaSierra LeoneSingaporeSomaliaSouth AfricaSouth AmericaSouth Central AsiaSouth Eastern AsiaSouthern EuropeSpainSri LankaSt. Vincent and the GrenadinesSudanSwedenSwitzerlandSyriaTaiwanThailandTrinidad and TobagoTurkeyUgandaUkraineUruguayUzbekistanVenezuelaVietnamWest IndiesWestern AfricaWestern AsiaWestern EuropeYemenZaireZimbabweAzores
3 or more Vehicles in Household
Income
Poverty
Unemployment
Labor Participation
Family Structure
Vehicle Availability
Education Level
Disability

3 or more Vehicles in Household Comparison

Liberians

Belgians

Tragic
Exceptional
17.0%
3 OR MORE VEHICLES IN HOUSEHOLD
0.1/ 100
METRIC RATING
290th/ 347
METRIC RANK
21.2%
3 OR MORE VEHICLES IN HOUSEHOLD
98.9/ 100
METRIC RATING
91st/ 347
METRIC RANK

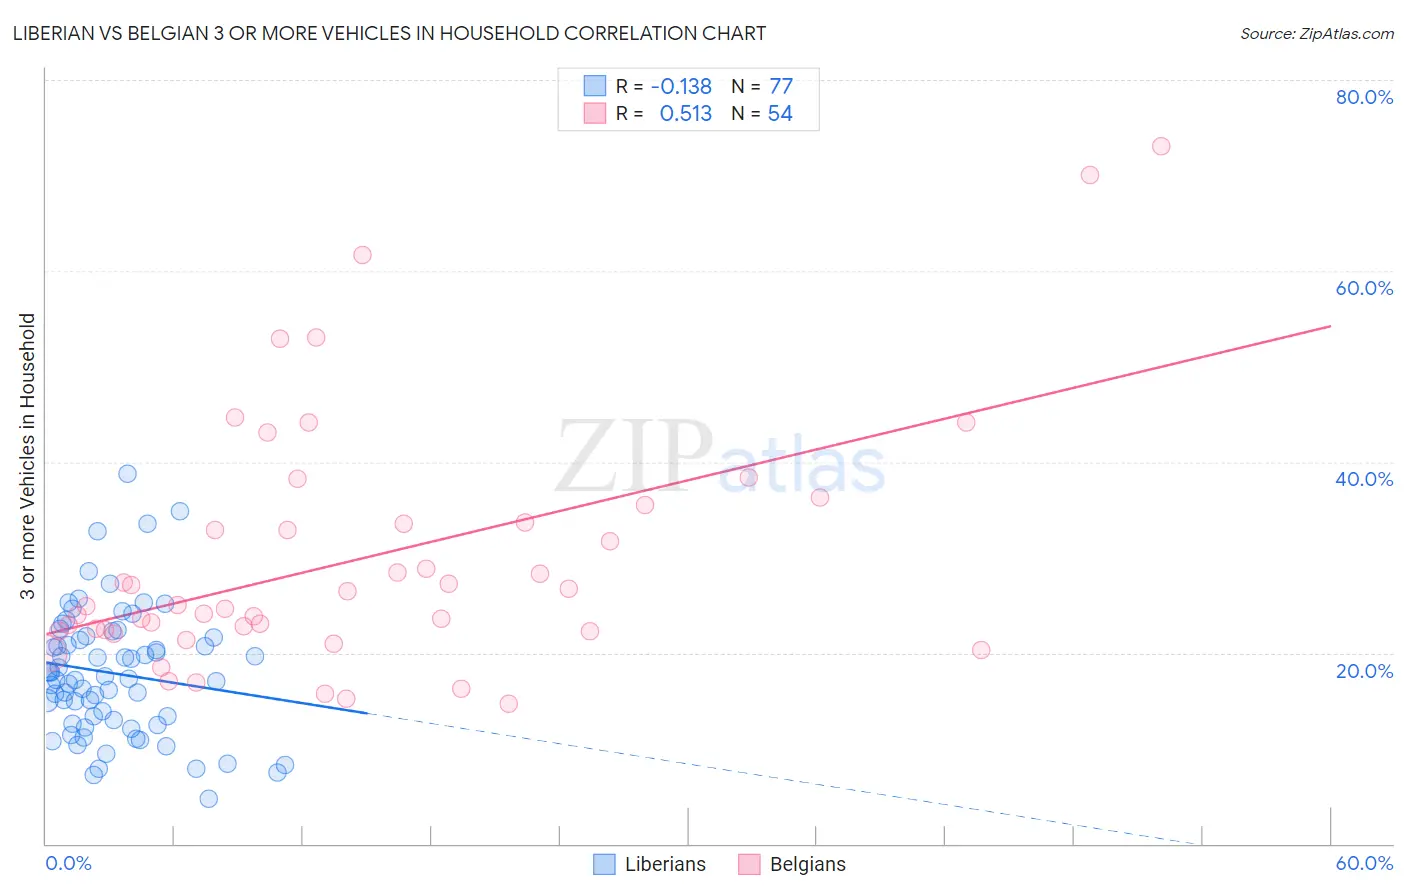
Liberian vs Belgian 3 or more Vehicles in Household Correlation Chart

The statistical analysis conducted on geographies consisting of 118,026,034 people shows a poor negative correlation between the proportion of Liberians and percentage of households with 3 or more vehicles available in the United States with a correlation coefficient (R) of -0.138 and weighted average of 17.0%. Similarly, the statistical analysis conducted on geographies consisting of 355,741,877 people shows a substantial positive correlation between the proportion of Belgians and percentage of households with 3 or more vehicles available in the United States with a correlation coefficient (R) of 0.513 and weighted average of 21.2%, a difference of 24.6%.
Liberian vs Belgian 3 or more Vehicles in Household

3 or more Vehicles in Household Correlation Summary

MeasurementLiberianBelgian
Minimum4.7%14.7%
Maximum38.8%73.1%
Range34.1%58.4%
Mean17.9%29.9%
Median17.2%25.0%
Interquartile 25% (IQ1)12.8%22.3%
Interquartile 75% (IQ3)21.7%33.6%
Interquartile Range (IQR)8.9%11.3%
Standard Deviation (Sample)6.7%13.1%
Standard Deviation (Population)6.7%12.9%

Similar Demographics by 3 or more Vehicles in Household

Demographics Similar to Liberians by 3 or more Vehicles in Household

In terms of 3 or more vehicles in household, the demographic groups most similar to Liberians are Immigrants from Congo (17.0%, a difference of 0.15%), Immigrants from Spain (17.0%, a difference of 0.27%), Bahamian (16.9%, a difference of 0.35%), Immigrants from Western Africa (16.9%, a difference of 0.46%), and Immigrants from Russia (16.9%, a difference of 0.51%).
DemographicsRating | Rank3 or more Vehicles in Household
Blacks/African Americans
0.3
/100
|
#283
Tragic
17.3%
Immigrants | Colombia
0.3
/100
|
#284
Tragic
17.3%
Immigrants | Croatia
0.2
/100
|
#285
Tragic
17.2%
Menominee
0.2
/100
|
#286
Tragic
17.2%
Immigrants | Brazil
0.2
/100
|
#287
Tragic
17.1%
Immigrants | Uruguay
0.2
/100
|
#288
Tragic
17.1%
Immigrants | Liberia
0.1
/100
|
#289
Tragic
17.1%
Liberians
0.1
/100
|
#290
Tragic
17.0%
Immigrants | Congo
0.1
/100
|
#291
Tragic
17.0%
Immigrants | Spain
0.1
/100
|
#292
Tragic
17.0%
Bahamians
0.1
/100
|
#293
Tragic
16.9%
Immigrants | Western Africa
0.1
/100
|
#294
Tragic
16.9%
Immigrants | Russia
0.1
/100
|
#295
Tragic
16.9%
Inupiat
0.1
/100
|
#296
Tragic
16.9%
Israelis
0.1
/100
|
#297
Tragic
16.8%

Demographics Similar to Belgians by 3 or more Vehicles in Household

In terms of 3 or more vehicles in household, the demographic groups most similar to Belgians are Apache (21.2%, a difference of 0.080%), Immigrants from Indonesia (21.1%, a difference of 0.28%), Immigrants from Afghanistan (21.2%, a difference of 0.33%), Immigrants from Cambodia (21.1%, a difference of 0.51%), and Marshallese (21.3%, a difference of 0.55%).
DemographicsRating | Rank3 or more Vehicles in Household
Icelanders
99.6
/100
|
#84
Exceptional
21.5%
Laotians
99.6
/100
|
#85
Exceptional
21.5%
Delaware
99.6
/100
|
#86
Exceptional
21.5%
Immigrants | Azores
99.5
/100
|
#87
Exceptional
21.5%
French
99.4
/100
|
#88
Exceptional
21.4%
Marshallese
99.2
/100
|
#89
Exceptional
21.3%
Immigrants | Afghanistan
99.1
/100
|
#90
Exceptional
21.2%
Belgians
98.9
/100
|
#91
Exceptional
21.2%
Apache
98.9
/100
|
#92
Exceptional
21.2%
Immigrants | Indonesia
98.8
/100
|
#93
Exceptional
21.1%
Immigrants | Cambodia
98.6
/100
|
#94
Exceptional
21.1%
Pakistanis
98.5
/100
|
#95
Exceptional
21.0%
Cree
98.4
/100
|
#96
Exceptional
21.0%
Canadians
98.3
/100
|
#97
Exceptional
21.0%
Hmong
98.2
/100
|
#98
Exceptional
21.0%