Immigrants from Western Africa vs Cuban 1 or more Vehicles in Household

COMPARE

Immigrants from Western Africa
Race
Ancestry
AfghanAfricanAlaska NativeAlaskan AthabascanAlbanianAleutAlsatianAmericanApacheArabArapahoArgentineanArmenianAssyrian/Chaldean/SyriacAustralianAustrianBahamianBangladeshiBarbadianBasqueBelgianBelizeanBermudanBhutaneseBlackfeetBolivianBrazilianBritishBritish West IndianBulgarianBurmeseCajunCambodianCanadianCape VerdeanCarpatho RusynCelticCentral AmericanCentral American IndianCherokeeCheyenneChickasawChileanChineseChippewaChoctawColombianColvilleComancheCosta RicanCreeCreekCroatianCrowCypriotCzechCzechoslovakianDanishDelawareDominicanDutchDutch West IndianEastern EuropeanEcuadorianEgyptianEnglishEstonianEthiopianEuropeanFijianFilipinoFinnishFrenchFrench American IndianFrench CanadianGermanGerman RussianGhanaianGreekGuamanian/ChamorroGuatemalanGuyaneseHaitianHmongHonduranHopiHoumaHungarianIcelanderIndian (Asian)IndonesianInupiatIranianIraqiIrishIroquoisIsraeliItalianJamaicanJapaneseJordanianKenyanKiowaKoreanLaotianLatvianLebaneseLiberianLithuanianLumbeeLuxembourgerMacedonianMalaysianMalteseMarshalleseMenomineeMexicanMexican American IndianMongolianMoroccanNative HawaiianNavajoNepaleseNew ZealanderNicaraguanNigerianNorthern EuropeanNorwegianOkinawanOsageOttawaPaiutePakistaniPalestinianPanamanianParaguayanPennsylvania GermanPeruvianPimaPolishPortuguesePotawatomiPuebloPuerto RicanPuget Sound SalishRomanianRussianSalvadoranSamoanScandinavianScotch-IrishScottishSeminoleSenegaleseSerbianShoshoneSierra LeoneanSiouxSlavicSlovakSloveneSomaliSouth AfricanSouth AmericanSouth American IndianSoviet UnionSpaniardSpanishSpanish AmericanSpanish American IndianSri LankanSubsaharan AfricanSudaneseSwedishSwissSyrianTaiwaneseThaiTlingit-HaidaTohono O'OdhamTonganTrinidadian and TobagonianTsimshianTurkishU.S. Virgin IslanderUgandanUkrainianUruguayanUteVenezuelanVietnameseWelshWest IndianYakamaYaquiYugoslavianYumanYup'ikZimbabwean
Immigration
NonimmigrantsImmigrantsAfghanistanAfricaAlbaniaArgentinaArmeniaAsiaAustraliaAustriaBahamasBangladeshBarbadosBelarusBelgiumBelizeBoliviaBosnia and HerzegovinaBrazilBulgariaBurma/MyanmarCabo VerdeCambodiaCameroonCanadaCaribbeanCentral AmericaChileChinaColombiaCongoCosta RicaCroatiaCubaCzechoslovakiaDenmarkDominicaDominican RepublicEastern AfricaEastern AsiaEastern EuropeEcuadorEgyptEl SalvadorEnglandEritreaEthiopiaEuropeFijiFranceGermanyGhanaGreeceGrenadaGuatemalaGuyanaHaitiHondurasHong KongHungaryIndiaIndonesiaIranIraqIrelandIsraelItalyJamaicaJapanJordanKazakhstanKenyaKoreaKuwaitLaosLatin AmericaLatviaLebanonLiberiaLithuaniaMalaysiaMexicoMicronesiaMiddle AfricaMoldovaMoroccoNepalNetherlandsNicaraguaNigeriaNorth AmericaNorth MacedoniaNorthern AfricaNorthern EuropeNorwayOceaniaPakistanPanamaPeruPhilippinesPolandPortugalRomaniaRussiaSaudi ArabiaScotlandSenegalSerbiaSierra LeoneSingaporeSomaliaSouth AfricaSouth AmericaSouth Central AsiaSouth Eastern AsiaSouthern EuropeSpainSri LankaSt. Vincent and the GrenadinesSudanSwedenSwitzerlandSyriaTaiwanThailandTrinidad and TobagoTurkeyUgandaUkraineUruguayUzbekistanVenezuelaVietnamWest IndiesWestern AfricaWestern AsiaWestern EuropeYemenZaireZimbabweAzores
Cuban
Race
Ancestry
AfghanAfricanAlaska NativeAlaskan AthabascanAlbanianAleutAlsatianAmericanApacheArabArapahoArgentineanArmenianAssyrian/Chaldean/SyriacAustralianAustrianBahamianBangladeshiBarbadianBasqueBelgianBelizeanBermudanBhutaneseBlackfeetBolivianBrazilianBritishBritish West IndianBulgarianBurmeseCajunCambodianCanadianCape VerdeanCarpatho RusynCelticCentral AmericanCentral American IndianCherokeeCheyenneChickasawChileanChineseChippewaChoctawColombianColvilleComancheCosta RicanCreeCreekCroatianCrowCubanCypriotCzechCzechoslovakianDanishDelawareDominicanDutchDutch West IndianEastern EuropeanEcuadorianEgyptianEnglishEstonianEthiopianEuropeanFijianFilipinoFinnishFrenchFrench American IndianFrench CanadianGermanGerman RussianGhanaianGreekGuamanian/ChamorroGuatemalanGuyaneseHaitianHmongHonduranHopiHoumaHungarianIcelanderIndian (Asian)IndonesianInupiatIranianIraqiIrishIroquoisIsraeliItalianJamaicanJapaneseJordanianKenyanKiowaKoreanLaotianLatvianLebaneseLiberianLithuanianLumbeeLuxembourgerMacedonianMalaysianMalteseMarshalleseMenomineeMexicanMexican American IndianMongolianMoroccanNative HawaiianNavajoNepaleseNew ZealanderNicaraguanNigerianNorthern EuropeanNorwegianOkinawanOsageOttawaPaiutePakistaniPalestinianPanamanianParaguayanPennsylvania GermanPeruvianPimaPolishPortuguesePotawatomiPuebloPuerto RicanPuget Sound SalishRomanianRussianSalvadoranSamoanScandinavianScotch-IrishScottishSeminoleSenegaleseSerbianShoshoneSierra LeoneanSiouxSlavicSlovakSloveneSomaliSouth AfricanSouth AmericanSouth American IndianSoviet UnionSpaniardSpanishSpanish AmericanSpanish American IndianSri LankanSubsaharan AfricanSudaneseSwedishSwissSyrianTaiwaneseThaiTlingit-HaidaTohono O'OdhamTonganTrinidadian and TobagonianTsimshianTurkishU.S. Virgin IslanderUgandanUkrainianUruguayanUteVenezuelanVietnameseWelshWest IndianYakamaYaquiYugoslavianYumanYup'ikZimbabwean
Immigration
NonimmigrantsImmigrantsAfghanistanAfricaAlbaniaArgentinaArmeniaAsiaAustraliaAustriaBahamasBangladeshBarbadosBelarusBelgiumBelizeBoliviaBosnia and HerzegovinaBrazilBulgariaBurma/MyanmarCabo VerdeCambodiaCameroonCanadaCaribbeanCentral AmericaChileChinaColombiaCongoCosta RicaCroatiaCubaCzechoslovakiaDenmarkDominicaDominican RepublicEastern AfricaEastern AsiaEastern EuropeEcuadorEgyptEl SalvadorEnglandEritreaEthiopiaEuropeFijiFranceGermanyGhanaGreeceGrenadaGuatemalaGuyanaHaitiHondurasHong KongHungaryIndiaIndonesiaIranIraqIrelandIsraelItalyJamaicaJapanJordanKazakhstanKenyaKoreaKuwaitLaosLatin AmericaLatviaLebanonLiberiaLithuaniaMalaysiaMexicoMicronesiaMiddle AfricaMoldovaMoroccoNepalNetherlandsNicaraguaNigeriaNorth AmericaNorth MacedoniaNorthern AfricaNorthern EuropeNorwayOceaniaPakistanPanamaPeruPhilippinesPolandPortugalRomaniaRussiaSaudi ArabiaScotlandSenegalSerbiaSierra LeoneSingaporeSomaliaSouth AfricaSouth AmericaSouth Central AsiaSouth Eastern AsiaSouthern EuropeSpainSri LankaSt. Vincent and the GrenadinesSudanSwedenSwitzerlandSyriaTaiwanThailandTrinidad and TobagoTurkeyUgandaUkraineUruguayUzbekistanVenezuelaVietnamWest IndiesWestern AsiaWestern EuropeYemenZaireZimbabweAzores
1 or more Vehicles in Household
Income
Poverty
Unemployment
Labor Participation
Family Structure
Vehicle Availability
Education Level
Disability

1 or more Vehicles in Household Comparison

Immigrants from Western Africa

Cubans

Tragic
Exceptional
84.9%
1 OR MORE VEHICLES IN HOUSEHOLD
0.0/ 100
METRIC RATING
306th/ 347
METRIC RANK
91.5%
1 OR MORE VEHICLES IN HOUSEHOLD
99.5/ 100
METRIC RATING
76th/ 347
METRIC RANK

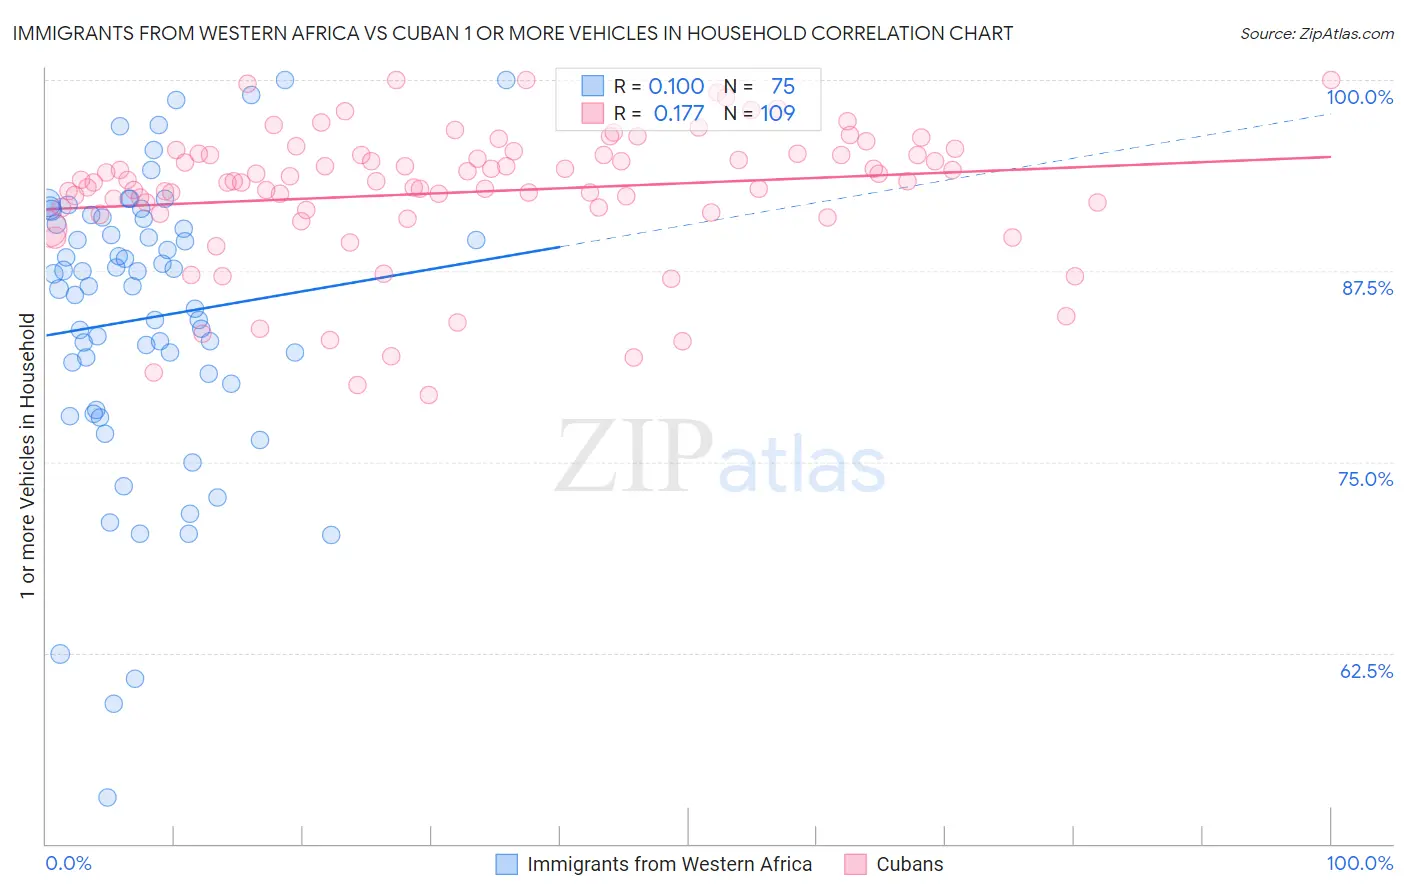
Immigrants from Western Africa vs Cuban 1 or more Vehicles in Household Correlation Chart

The statistical analysis conducted on geographies consisting of 357,592,771 people shows a poor positive correlation between the proportion of Immigrants from Western Africa and percentage of households with 1 or more vehicles available in the United States with a correlation coefficient (R) of 0.100 and weighted average of 84.9%. Similarly, the statistical analysis conducted on geographies consisting of 448,885,353 people shows a poor positive correlation between the proportion of Cubans and percentage of households with 1 or more vehicles available in the United States with a correlation coefficient (R) of 0.177 and weighted average of 91.5%, a difference of 7.8%.
Immigrants from Western Africa vs Cuban 1 or more Vehicles in Household

1 or more Vehicles in Household Correlation Summary

MeasurementImmigrants from Western AfricaCuban
Minimum53.0%79.4%
Maximum100.0%100.0%
Range47.0%20.6%
Mean84.4%92.7%
Median86.5%93.3%
Interquartile 25% (IQ1)80.2%91.4%
Interquartile 75% (IQ3)90.9%95.2%
Interquartile Range (IQR)10.8%3.8%
Standard Deviation (Sample)9.5%4.4%
Standard Deviation (Population)9.4%4.4%

Similar Demographics by 1 or more Vehicles in Household

Demographics Similar to Immigrants from Western Africa by 1 or more Vehicles in Household

In terms of 1 or more vehicles in household, the demographic groups most similar to Immigrants from Western Africa are Immigrants from China (84.9%, a difference of 0.020%), Tohono O'odham (84.7%, a difference of 0.26%), Immigrants from Belize (84.7%, a difference of 0.29%), Immigrants from Haiti (84.7%, a difference of 0.30%), and U.S. Virgin Islander (84.6%, a difference of 0.33%).
DemographicsRating | Rank1 or more Vehicles in Household
Yuman
0.0
/100
|
#299
Tragic
85.5%
Immigrants | Russia
0.0
/100
|
#300
Tragic
85.4%
Immigrants | Panama
0.0
/100
|
#301
Tragic
85.4%
Moroccans
0.0
/100
|
#302
Tragic
85.4%
Immigrants | Greece
0.0
/100
|
#303
Tragic
85.4%
Immigrants | Ukraine
0.0
/100
|
#304
Tragic
85.2%
Immigrants | China
0.0
/100
|
#305
Tragic
84.9%
Immigrants | Western Africa
0.0
/100
|
#306
Tragic
84.9%
Tohono O'odham
0.0
/100
|
#307
Tragic
84.7%
Immigrants | Belize
0.0
/100
|
#308
Tragic
84.7%
Immigrants | Haiti
0.0
/100
|
#309
Tragic
84.7%
U.S. Virgin Islanders
0.0
/100
|
#310
Tragic
84.6%
Puerto Ricans
0.0
/100
|
#311
Tragic
84.6%
Cape Verdeans
0.0
/100
|
#312
Tragic
84.5%
Immigrants | Israel
0.0
/100
|
#313
Tragic
84.5%

Demographics Similar to Cubans by 1 or more Vehicles in Household

In terms of 1 or more vehicles in household, the demographic groups most similar to Cubans are Portuguese (91.6%, a difference of 0.020%), Immigrants from Philippines (91.5%, a difference of 0.040%), Iranian (91.5%, a difference of 0.040%), Immigrants from South Central Asia (91.5%, a difference of 0.060%), and Bolivian (91.5%, a difference of 0.070%).
DemographicsRating | Rank1 or more Vehicles in Household
Palestinians
99.7
/100
|
#69
Exceptional
91.7%
Lithuanians
99.7
/100
|
#70
Exceptional
91.7%
Poles
99.7
/100
|
#71
Exceptional
91.7%
Cajuns
99.7
/100
|
#72
Exceptional
91.7%
Immigrants | Iran
99.7
/100
|
#73
Exceptional
91.7%
Immigrants | Lebanon
99.6
/100
|
#74
Exceptional
91.6%
Portuguese
99.5
/100
|
#75
Exceptional
91.6%
Cubans
99.5
/100
|
#76
Exceptional
91.5%
Immigrants | Philippines
99.4
/100
|
#77
Exceptional
91.5%
Iranians
99.4
/100
|
#78
Exceptional
91.5%
Immigrants | South Central Asia
99.4
/100
|
#79
Exceptional
91.5%
Bolivians
99.4
/100
|
#80
Exceptional
91.5%
Immigrants | South Eastern Asia
99.3
/100
|
#81
Exceptional
91.4%
Lebanese
99.3
/100
|
#82
Exceptional
91.4%
Immigrants | England
99.3
/100
|
#83
Exceptional
91.4%