Immigrants from Sri Lanka vs Immigrants from Yemen 3 or more Vehicles in Household
COMPARE
Immigrants from Sri Lanka
Immigrants from Yemen
3 or more Vehicles in Household
3 or more Vehicles in Household Comparison
Immigrants from Sri Lanka
Immigrants from Yemen
19.2%
3 OR MORE VEHICLES IN HOUSEHOLD
30.7/ 100
METRIC RATING
185th/ 347
METRIC RANK
14.2%
3 OR MORE VEHICLES IN HOUSEHOLD
0.0/ 100
METRIC RATING
324th/ 347
METRIC RANK
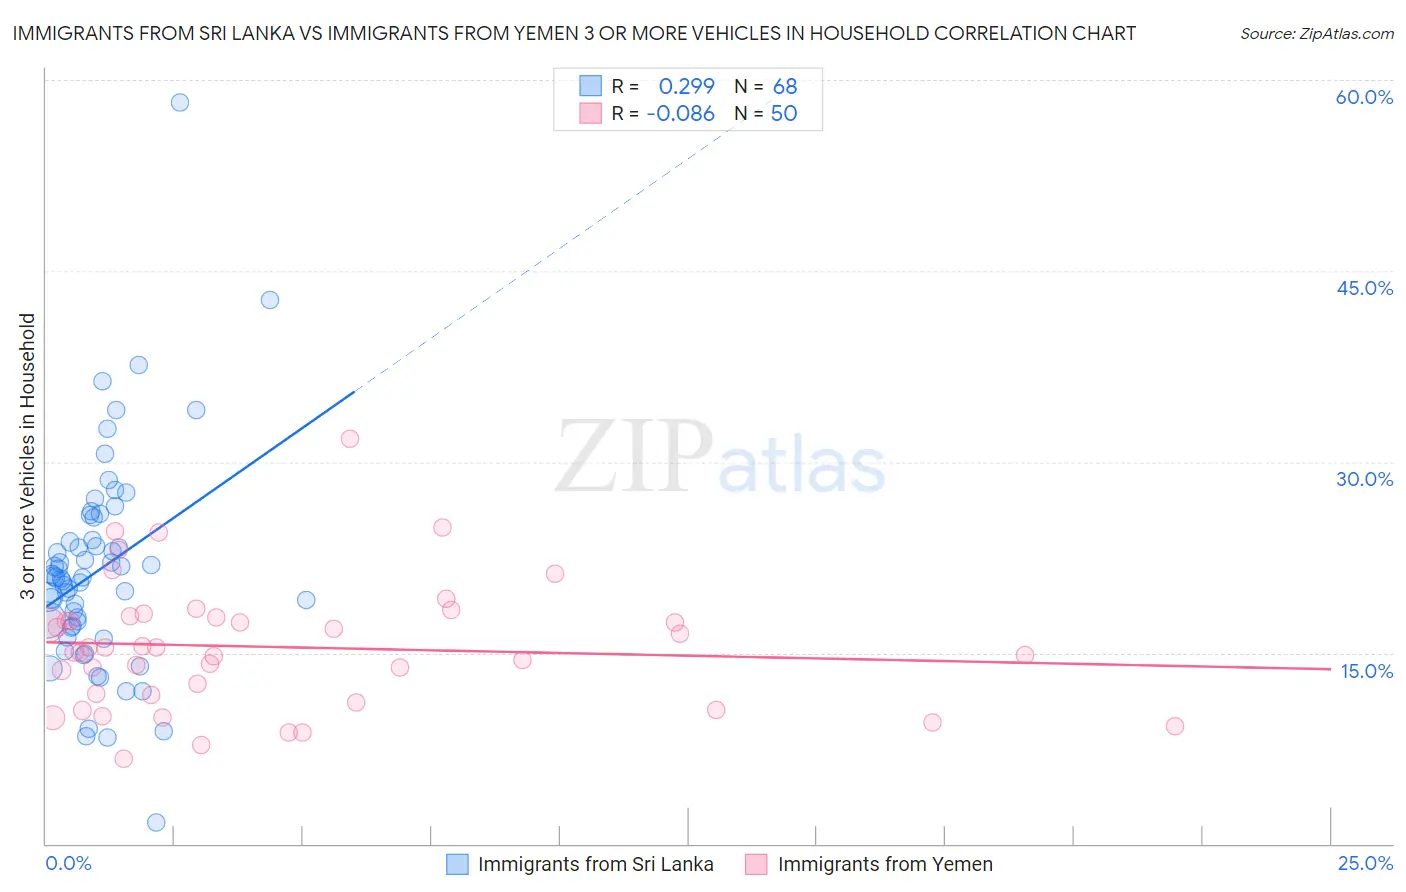
Immigrants from Sri Lanka vs Immigrants from Yemen 3 or more Vehicles in Household Correlation Chart
The statistical analysis conducted on geographies consisting of 149,676,246 people shows a weak positive correlation between the proportion of Immigrants from Sri Lanka and percentage of households with 3 or more vehicles available in the United States with a correlation coefficient (R) of 0.299 and weighted average of 19.2%. Similarly, the statistical analysis conducted on geographies consisting of 82,431,124 people shows a slight negative correlation between the proportion of Immigrants from Yemen and percentage of households with 3 or more vehicles available in the United States with a correlation coefficient (R) of -0.086 and weighted average of 14.2%, a difference of 34.8%.
3 or more Vehicles in Household Correlation Summary
| Measurement | Immigrants from Sri Lanka | Immigrants from Yemen |
| Minimum | 1.7% | 6.7% |
| Maximum | 58.3% | 31.8% |
| Range | 56.6% | 25.1% |
| Mean | 21.5% | 15.5% |
| Median | 20.9% | 15.2% |
| Interquartile 25% (IQ1) | 17.0% | 11.6% |
| Interquartile 75% (IQ3) | 24.8% | 17.8% |
| Interquartile Range (IQR) | 7.7% | 6.1% |
| Standard Deviation (Sample) | 8.6% | 5.0% |
| Standard Deviation (Population) | 8.5% | 5.0% |
Similar Demographics by 3 or more Vehicles in Household
Demographics Similar to Immigrants from Sri Lanka by 3 or more Vehicles in Household
In terms of 3 or more vehicles in household, the demographic groups most similar to Immigrants from Sri Lanka are Immigrants from Sweden (19.2%, a difference of 0.16%), Immigrants from Hong Kong (19.2%, a difference of 0.22%), Latvian (19.3%, a difference of 0.44%), Immigrants from Kuwait (19.1%, a difference of 0.44%), and Indian (Asian) (19.1%, a difference of 0.44%).
| Demographics | Rating | Rank | 3 or more Vehicles in Household |
| Immigrants | Syria | 40.3 /100 | #178 | Average 19.4% |
| Immigrants | South Central Asia | 38.9 /100 | #179 | Fair 19.3% |
| South Africans | 37.5 /100 | #180 | Fair 19.3% |
| Romanians | 37.1 /100 | #181 | Fair 19.3% |
| Cubans | 36.6 /100 | #182 | Fair 19.3% |
| Cajuns | 36.0 /100 | #183 | Fair 19.3% |
| Latvians | 35.7 /100 | #184 | Fair 19.3% |
| Immigrants | Sri Lanka | 30.7 /100 | #185 | Fair 19.2% |
| Immigrants | Sweden | 29.0 /100 | #186 | Fair 19.2% |
| Immigrants | Hong Kong | 28.3 /100 | #187 | Fair 19.2% |
| Immigrants | Kuwait | 26.1 /100 | #188 | Fair 19.1% |
| Indians (Asian) | 26.0 /100 | #189 | Fair 19.1% |
| Immigrants | Zimbabwe | 25.5 /100 | #190 | Fair 19.1% |
| South American Indians | 25.4 /100 | #191 | Fair 19.1% |
| Kenyans | 24.7 /100 | #192 | Fair 19.1% |
Demographics Similar to Immigrants from Yemen by 3 or more Vehicles in Household
In terms of 3 or more vehicles in household, the demographic groups most similar to Immigrants from Yemen are Senegalese (14.2%, a difference of 0.080%), Soviet Union (14.2%, a difference of 0.41%), Ecuadorian (14.1%, a difference of 1.3%), Immigrants from Albania (14.0%, a difference of 2.0%), and Immigrants from Caribbean (14.6%, a difference of 2.3%).
| Demographics | Rating | Rank | 3 or more Vehicles in Household |
| Jamaicans | 0.0 /100 | #317 | Tragic 15.2% |
| Immigrants | Haiti | 0.0 /100 | #318 | Tragic 15.2% |
| Cape Verdeans | 0.0 /100 | #319 | Tragic 15.0% |
| Yup'ik | 0.0 /100 | #320 | Tragic 14.8% |
| Immigrants | Jamaica | 0.0 /100 | #321 | Tragic 14.7% |
| Immigrants | West Indies | 0.0 /100 | #322 | Tragic 14.6% |
| Immigrants | Caribbean | 0.0 /100 | #323 | Tragic 14.6% |
| Immigrants | Yemen | 0.0 /100 | #324 | Tragic 14.2% |
| Senegalese | 0.0 /100 | #325 | Tragic 14.2% |
| Soviet Union | 0.0 /100 | #326 | Tragic 14.2% |
| Ecuadorians | 0.0 /100 | #327 | Tragic 14.1% |
| Immigrants | Albania | 0.0 /100 | #328 | Tragic 14.0% |
| Immigrants | Senegal | 0.0 /100 | #329 | Tragic 13.8% |
| West Indians | 0.0 /100 | #330 | Tragic 13.7% |
| Immigrants | Dominica | 0.0 /100 | #331 | Tragic 13.7% |