Immigrants from Latin America vs Immigrants from India 1 or more Vehicles in Household

COMPARE

Immigrants from Latin America
Race
Ancestry
AfghanAfricanAlaska NativeAlaskan AthabascanAlbanianAleutAlsatianAmericanApacheArabArapahoArgentineanArmenianAssyrian/Chaldean/SyriacAustralianAustrianBahamianBangladeshiBarbadianBasqueBelgianBelizeanBermudanBhutaneseBlackfeetBolivianBrazilianBritishBritish West IndianBulgarianBurmeseCajunCambodianCanadianCape VerdeanCarpatho RusynCelticCentral AmericanCentral American IndianCherokeeCheyenneChickasawChileanChineseChippewaChoctawColombianColvilleComancheCosta RicanCreeCreekCroatianCrowCubanCypriotCzechCzechoslovakianDanishDelawareDominicanDutchDutch West IndianEastern EuropeanEcuadorianEgyptianEnglishEstonianEthiopianEuropeanFijianFilipinoFinnishFrenchFrench American IndianFrench CanadianGermanGerman RussianGhanaianGreekGuamanian/ChamorroGuatemalanGuyaneseHaitianHmongHonduranHopiHoumaHungarianIcelanderIndian (Asian)IndonesianInupiatIranianIraqiIrishIroquoisIsraeliItalianJamaicanJapaneseJordanianKenyanKiowaKoreanLaotianLatvianLebaneseLiberianLithuanianLumbeeLuxembourgerMacedonianMalaysianMalteseMarshalleseMenomineeMexicanMexican American IndianMongolianMoroccanNative HawaiianNavajoNepaleseNew ZealanderNicaraguanNigerianNorthern EuropeanNorwegianOkinawanOsageOttawaPaiutePakistaniPalestinianPanamanianParaguayanPennsylvania GermanPeruvianPimaPolishPortuguesePotawatomiPuebloPuerto RicanPuget Sound SalishRomanianRussianSalvadoranSamoanScandinavianScotch-IrishScottishSeminoleSenegaleseSerbianShoshoneSierra LeoneanSiouxSlavicSlovakSloveneSomaliSouth AfricanSouth AmericanSouth American IndianSoviet UnionSpaniardSpanishSpanish AmericanSpanish American IndianSri LankanSubsaharan AfricanSudaneseSwedishSwissSyrianTaiwaneseThaiTlingit-HaidaTohono O'OdhamTonganTrinidadian and TobagonianTsimshianTurkishU.S. Virgin IslanderUgandanUkrainianUruguayanUteVenezuelanVietnameseWelshWest IndianYakamaYaquiYugoslavianYumanYup'ikZimbabwean
Immigration
NonimmigrantsImmigrantsAfghanistanAfricaAlbaniaArgentinaArmeniaAsiaAustraliaAustriaBahamasBangladeshBarbadosBelarusBelgiumBelizeBoliviaBosnia and HerzegovinaBrazilBulgariaBurma/MyanmarCabo VerdeCambodiaCameroonCanadaCaribbeanCentral AmericaChileChinaColombiaCongoCosta RicaCroatiaCubaCzechoslovakiaDenmarkDominicaDominican RepublicEastern AfricaEastern AsiaEastern EuropeEcuadorEgyptEl SalvadorEnglandEritreaEthiopiaEuropeFijiFranceGermanyGhanaGreeceGrenadaGuatemalaGuyanaHaitiHondurasHong KongHungaryIndonesiaIranIraqIrelandIsraelItalyJamaicaJapanJordanKazakhstanKenyaKoreaKuwaitLaosLatin AmericaLatviaLebanonLiberiaLithuaniaMalaysiaMexicoMicronesiaMiddle AfricaMoldovaMoroccoNepalNetherlandsNicaraguaNigeriaNorth AmericaNorth MacedoniaNorthern AfricaNorthern EuropeNorwayOceaniaPakistanPanamaPeruPhilippinesPolandPortugalRomaniaRussiaSaudi ArabiaScotlandSenegalSerbiaSierra LeoneSingaporeSomaliaSouth AfricaSouth AmericaSouth Central AsiaSouth Eastern AsiaSouthern EuropeSpainSri LankaSt. Vincent and the GrenadinesSudanSwedenSwitzerlandSyriaTaiwanThailandTrinidad and TobagoTurkeyUgandaUkraineUruguayUzbekistanVenezuelaVietnamWest IndiesWestern AfricaWestern AsiaWestern EuropeYemenZaireZimbabweAzores
Immigrants from India
Race
Ancestry
AfghanAfricanAlaska NativeAlaskan AthabascanAlbanianAleutAlsatianAmericanApacheArabArapahoArgentineanArmenianAssyrian/Chaldean/SyriacAustralianAustrianBahamianBangladeshiBarbadianBasqueBelgianBelizeanBermudanBhutaneseBlackfeetBolivianBrazilianBritishBritish West IndianBulgarianBurmeseCajunCambodianCanadianCape VerdeanCarpatho RusynCelticCentral AmericanCentral American IndianCherokeeCheyenneChickasawChileanChineseChippewaChoctawColombianColvilleComancheCosta RicanCreeCreekCroatianCrowCubanCypriotCzechCzechoslovakianDanishDelawareDominicanDutchDutch West IndianEastern EuropeanEcuadorianEgyptianEnglishEstonianEthiopianEuropeanFijianFilipinoFinnishFrenchFrench American IndianFrench CanadianGermanGerman RussianGhanaianGreekGuamanian/ChamorroGuatemalanGuyaneseHaitianHmongHonduranHopiHoumaHungarianIcelanderIndian (Asian)IndonesianInupiatIranianIraqiIrishIroquoisIsraeliItalianJamaicanJapaneseJordanianKenyanKiowaKoreanLaotianLatvianLebaneseLiberianLithuanianLumbeeLuxembourgerMacedonianMalaysianMalteseMarshalleseMenomineeMexicanMexican American IndianMongolianMoroccanNative HawaiianNavajoNepaleseNew ZealanderNicaraguanNigerianNorthern EuropeanNorwegianOkinawanOsageOttawaPaiutePakistaniPalestinianPanamanianParaguayanPennsylvania GermanPeruvianPimaPolishPortuguesePotawatomiPuebloPuerto RicanPuget Sound SalishRomanianRussianSalvadoranSamoanScandinavianScotch-IrishScottishSeminoleSenegaleseSerbianShoshoneSierra LeoneanSiouxSlavicSlovakSloveneSomaliSouth AfricanSouth AmericanSouth American IndianSoviet UnionSpaniardSpanishSpanish AmericanSpanish American IndianSri LankanSubsaharan AfricanSudaneseSwedishSwissSyrianTaiwaneseThaiTlingit-HaidaTohono O'OdhamTonganTrinidadian and TobagonianTsimshianTurkishU.S. Virgin IslanderUgandanUkrainianUruguayanUteVenezuelanVietnameseWelshWest IndianYakamaYaquiYugoslavianYumanYup'ikZimbabwean
Immigration
NonimmigrantsImmigrantsAfghanistanAfricaAlbaniaArgentinaArmeniaAsiaAustraliaAustriaBahamasBangladeshBarbadosBelarusBelgiumBelizeBoliviaBosnia and HerzegovinaBrazilBulgariaBurma/MyanmarCabo VerdeCambodiaCameroonCanadaCaribbeanCentral AmericaChileChinaColombiaCongoCosta RicaCroatiaCubaCzechoslovakiaDenmarkDominicaDominican RepublicEastern AfricaEastern AsiaEastern EuropeEcuadorEgyptEl SalvadorEnglandEritreaEthiopiaEuropeFijiFranceGermanyGhanaGreeceGrenadaGuatemalaGuyanaHaitiHondurasHong KongHungaryIndiaIndonesiaIranIraqIrelandIsraelItalyJamaicaJapanJordanKazakhstanKenyaKoreaKuwaitLaosLatviaLebanonLiberiaLithuaniaMalaysiaMexicoMicronesiaMiddle AfricaMoldovaMoroccoNepalNetherlandsNicaraguaNigeriaNorth AmericaNorth MacedoniaNorthern AfricaNorthern EuropeNorwayOceaniaPakistanPanamaPeruPhilippinesPolandPortugalRomaniaRussiaSaudi ArabiaScotlandSenegalSerbiaSierra LeoneSingaporeSomaliaSouth AfricaSouth AmericaSouth Central AsiaSouth Eastern AsiaSouthern EuropeSpainSri LankaSt. Vincent and the GrenadinesSudanSwedenSwitzerlandSyriaTaiwanThailandTrinidad and TobagoTurkeyUgandaUkraineUruguayUzbekistanVenezuelaVietnamWest IndiesWestern AfricaWestern AsiaWestern EuropeYemenZaireZimbabweAzores
1 or more Vehicles in Household
Income
Poverty
Unemployment
Labor Participation
Family Structure
Vehicle Availability
Education Level
Disability

1 or more Vehicles in Household Comparison

Immigrants from Latin America

Immigrants from India

Good
Exceptional
89.8%
1 OR MORE VEHICLES IN HOUSEHOLD
60.3/ 100
METRIC RATING
167th/ 347
METRIC RANK
91.9%
1 OR MORE VEHICLES IN HOUSEHOLD
99.8/ 100
METRIC RATING
61st/ 347
METRIC RANK

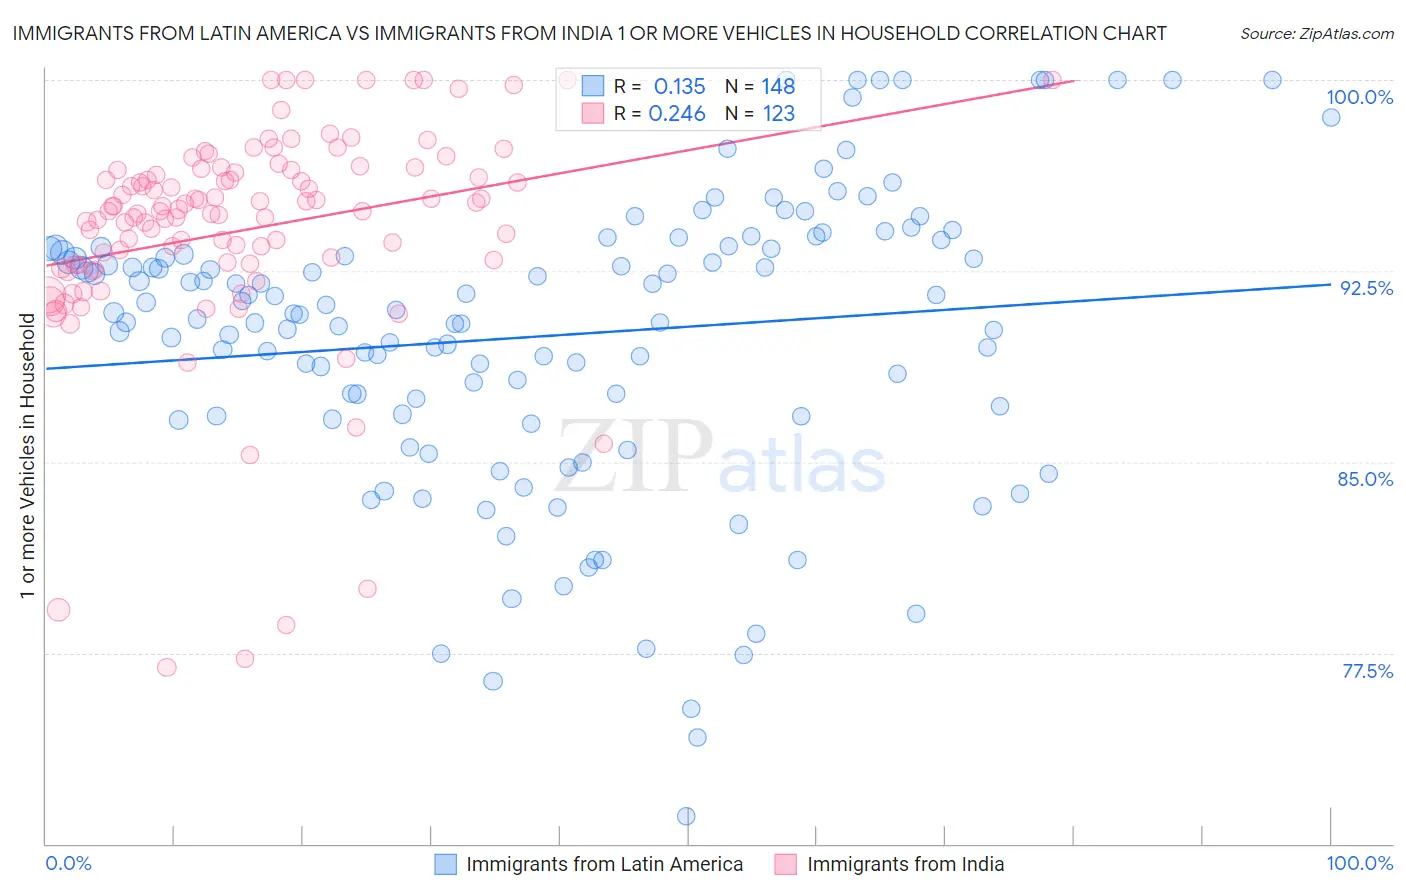
Immigrants from Latin America vs Immigrants from India 1 or more Vehicles in Household Correlation Chart

The statistical analysis conducted on geographies consisting of 546,306,892 people shows a poor positive correlation between the proportion of Immigrants from Latin America and percentage of households with 1 or more vehicles available in the United States with a correlation coefficient (R) of 0.135 and weighted average of 89.8%. Similarly, the statistical analysis conducted on geographies consisting of 433,708,630 people shows a weak positive correlation between the proportion of Immigrants from India and percentage of households with 1 or more vehicles available in the United States with a correlation coefficient (R) of 0.246 and weighted average of 91.9%, a difference of 2.3%.
Immigrants from Latin America vs Immigrants from India 1 or more Vehicles in Household

1 or more Vehicles in Household Correlation Summary

MeasurementImmigrants from Latin AmericaImmigrants from India
Minimum71.1%76.9%
Maximum100.0%100.0%
Range28.9%23.1%
Mean89.9%94.1%
Median90.9%94.9%
Interquartile 25% (IQ1)86.8%92.7%
Interquartile 75% (IQ3)93.4%96.5%
Interquartile Range (IQR)6.5%3.7%
Standard Deviation (Sample)5.8%4.3%
Standard Deviation (Population)5.7%4.3%

Similar Demographics by 1 or more Vehicles in Household

Demographics Similar to Immigrants from Latin America by 1 or more Vehicles in Household

In terms of 1 or more vehicles in household, the demographic groups most similar to Immigrants from Latin America are Immigrants from Cambodia (89.8%, a difference of 0.0%), Native/Alaskan (89.8%, a difference of 0.010%), Immigrants from Middle Africa (89.9%, a difference of 0.030%), Immigrants from Saudi Arabia (89.9%, a difference of 0.040%), and Immigrants from Costa Rica (89.8%, a difference of 0.040%).
DemographicsRating | Rank1 or more Vehicles in Household
Immigrants | Indonesia
68.8
/100
|
#160
Good
90.0%
Salvadorans
68.7
/100
|
#161
Good
90.0%
Spanish American Indians
67.0
/100
|
#162
Good
89.9%
Immigrants | Austria
65.5
/100
|
#163
Good
89.9%
Comanche
63.4
/100
|
#164
Good
89.9%
Immigrants | Saudi Arabia
62.6
/100
|
#165
Good
89.9%
Immigrants | Middle Africa
62.2
/100
|
#166
Good
89.9%
Immigrants | Latin America
60.3
/100
|
#167
Good
89.8%
Immigrants | Cambodia
60.1
/100
|
#168
Good
89.8%
Natives/Alaskans
59.5
/100
|
#169
Average
89.8%
Immigrants | Costa Rica
57.6
/100
|
#170
Average
89.8%
French American Indians
54.4
/100
|
#171
Average
89.8%
Indonesians
53.0
/100
|
#172
Average
89.7%
Lumbee
52.8
/100
|
#173
Average
89.7%
Filipinos
50.0
/100
|
#174
Average
89.7%

Demographics Similar to Immigrants from India by 1 or more Vehicles in Household

In terms of 1 or more vehicles in household, the demographic groups most similar to Immigrants from India are Thai (91.9%, a difference of 0.0%), Slovak (91.9%, a difference of 0.010%), Chinese (91.9%, a difference of 0.030%), Croatian (91.9%, a difference of 0.030%), and Venezuelan (91.9%, a difference of 0.040%).
DemographicsRating | Rank1 or more Vehicles in Household
Slovenes
99.9
/100
|
#54
Exceptional
92.0%
Immigrants | Afghanistan
99.9
/100
|
#55
Exceptional
92.0%
Immigrants | Venezuela
99.9
/100
|
#56
Exceptional
92.0%
Iraqis
99.8
/100
|
#57
Exceptional
91.9%
Immigrants | Mexico
99.8
/100
|
#58
Exceptional
91.9%
Venezuelans
99.8
/100
|
#59
Exceptional
91.9%
Slovaks
99.8
/100
|
#60
Exceptional
91.9%
Immigrants | India
99.8
/100
|
#61
Exceptional
91.9%
Thais
99.8
/100
|
#62
Exceptional
91.9%
Chinese
99.8
/100
|
#63
Exceptional
91.9%
Croatians
99.8
/100
|
#64
Exceptional
91.9%
Immigrants | Laos
99.8
/100
|
#65
Exceptional
91.8%
Canadians
99.8
/100
|
#66
Exceptional
91.8%
Spaniards
99.8
/100
|
#67
Exceptional
91.8%
Immigrants | Scotland
99.7
/100
|
#68
Exceptional
91.8%