Immigrants from Jordan vs Kiowa 3 or more Vehicles in Household
COMPARE
Immigrants from Jordan
Kiowa
3 or more Vehicles in Household
3 or more Vehicles in Household Comparison
Immigrants from Jordan
Kiowa
19.9%
3 OR MORE VEHICLES IN HOUSEHOLD
75.0/ 100
METRIC RATING
154th/ 347
METRIC RANK
19.5%
3 OR MORE VEHICLES IN HOUSEHOLD
50.9/ 100
METRIC RATING
172nd/ 347
METRIC RANK
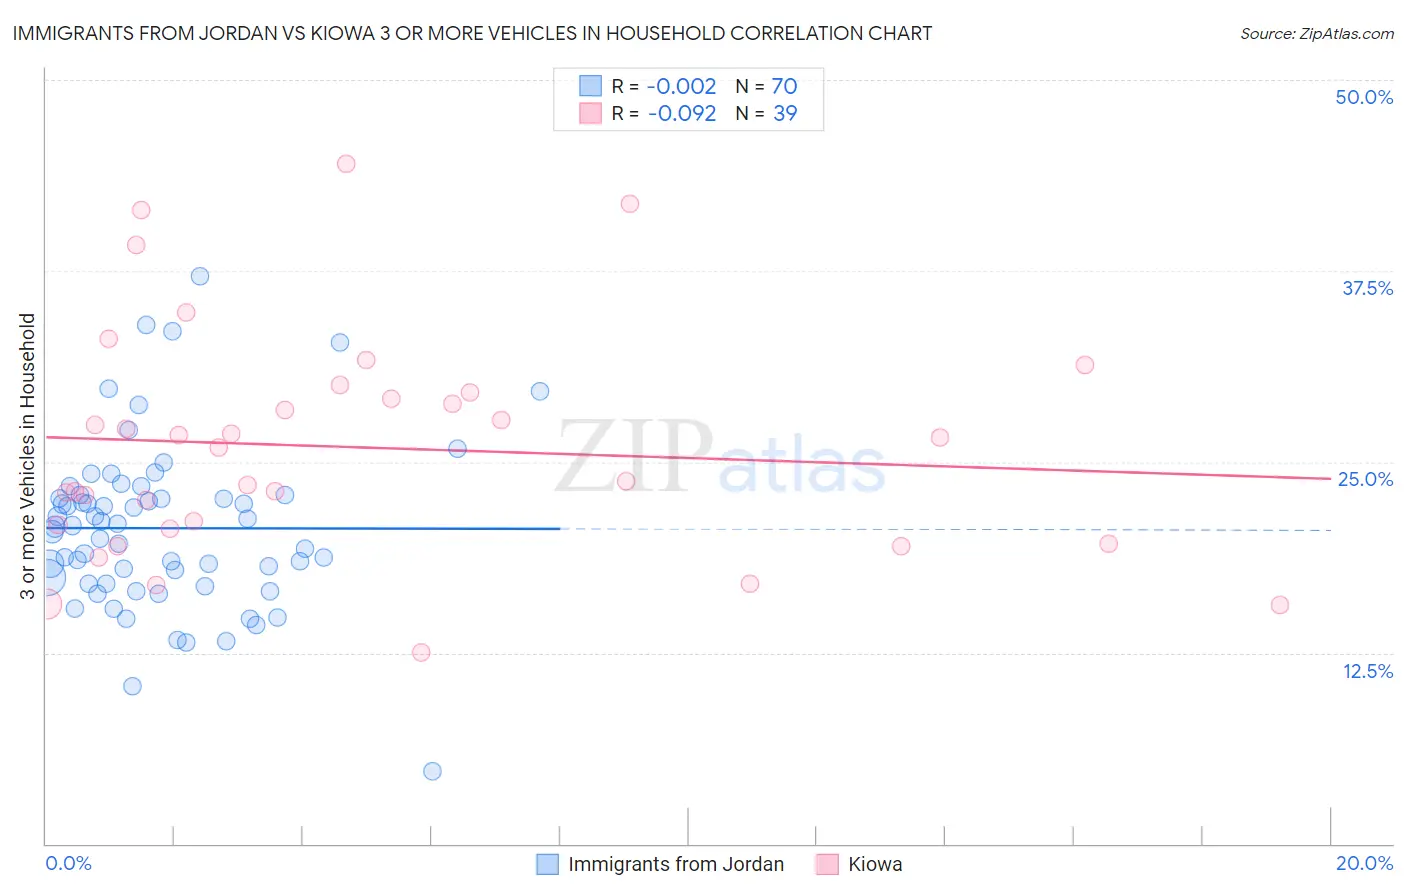
Immigrants from Jordan vs Kiowa 3 or more Vehicles in Household Correlation Chart
The statistical analysis conducted on geographies consisting of 181,207,315 people shows no correlation between the proportion of Immigrants from Jordan and percentage of households with 3 or more vehicles available in the United States with a correlation coefficient (R) of -0.002 and weighted average of 19.9%. Similarly, the statistical analysis conducted on geographies consisting of 56,098,357 people shows a slight negative correlation between the proportion of Kiowa and percentage of households with 3 or more vehicles available in the United States with a correlation coefficient (R) of -0.092 and weighted average of 19.5%, a difference of 2.0%.
3 or more Vehicles in Household Correlation Summary
| Measurement | Immigrants from Jordan | Kiowa |
| Minimum | 4.7% | 12.5% |
| Maximum | 37.1% | 44.5% |
| Range | 32.4% | 32.0% |
| Mean | 20.7% | 25.9% |
| Median | 20.8% | 26.0% |
| Interquartile 25% (IQ1) | 17.0% | 20.6% |
| Interquartile 75% (IQ3) | 22.8% | 29.5% |
| Interquartile Range (IQR) | 5.8% | 8.9% |
| Standard Deviation (Sample) | 5.5% | 7.5% |
| Standard Deviation (Population) | 5.5% | 7.4% |
Demographics Similar to Immigrants from Jordan and Kiowa by 3 or more Vehicles in Household
In terms of 3 or more vehicles in household, the demographic groups most similar to Immigrants from Jordan are Yuman (19.9%, a difference of 0.060%), Tlingit-Haida (19.9%, a difference of 0.15%), Thai (19.8%, a difference of 0.37%), Hungarian (19.8%, a difference of 0.42%), and Armenian (19.8%, a difference of 0.57%). Similarly, the demographic groups most similar to Kiowa are Immigrants from Northern Europe (19.5%, a difference of 0.050%), Immigrants from Western Europe (19.5%, a difference of 0.18%), Iraqi (19.6%, a difference of 0.39%), Immigrants from Denmark (19.6%, a difference of 0.51%), and Peruvian (19.6%, a difference of 0.60%).
| Demographics | Rating | Rank | 3 or more Vehicles in Household |
| Yuman | 75.6 /100 | #153 | Good 19.9% |
| Immigrants | Jordan | 75.0 /100 | #154 | Good 19.9% |
| Tlingit-Haida | 73.4 /100 | #155 | Good 19.9% |
| Thais | 71.1 /100 | #156 | Good 19.8% |
| Hungarians | 70.5 /100 | #157 | Good 19.8% |
| Armenians | 68.8 /100 | #158 | Good 19.8% |
| Immigrants | Pakistan | 68.2 /100 | #159 | Good 19.8% |
| Immigrants | Lebanon | 67.6 /100 | #160 | Good 19.8% |
| Immigrants | Guatemala | 65.6 /100 | #161 | Good 19.7% |
| Estonians | 63.2 /100 | #162 | Good 19.7% |
| Chileans | 63.0 /100 | #163 | Good 19.7% |
| Yugoslavians | 62.9 /100 | #164 | Good 19.7% |
| Immigrants | Costa Rica | 61.9 /100 | #165 | Good 19.7% |
| Immigrants | Cameroon | 60.9 /100 | #166 | Good 19.7% |
| Ukrainians | 58.9 /100 | #167 | Average 19.6% |
| Peruvians | 58.8 /100 | #168 | Average 19.6% |
| Immigrants | Denmark | 57.6 /100 | #169 | Average 19.6% |
| Iraqis | 56.0 /100 | #170 | Average 19.6% |
| Immigrants | Western Europe | 53.2 /100 | #171 | Average 19.5% |
| Kiowa | 50.9 /100 | #172 | Average 19.5% |
| Immigrants | Northern Europe | 50.2 /100 | #173 | Average 19.5% |