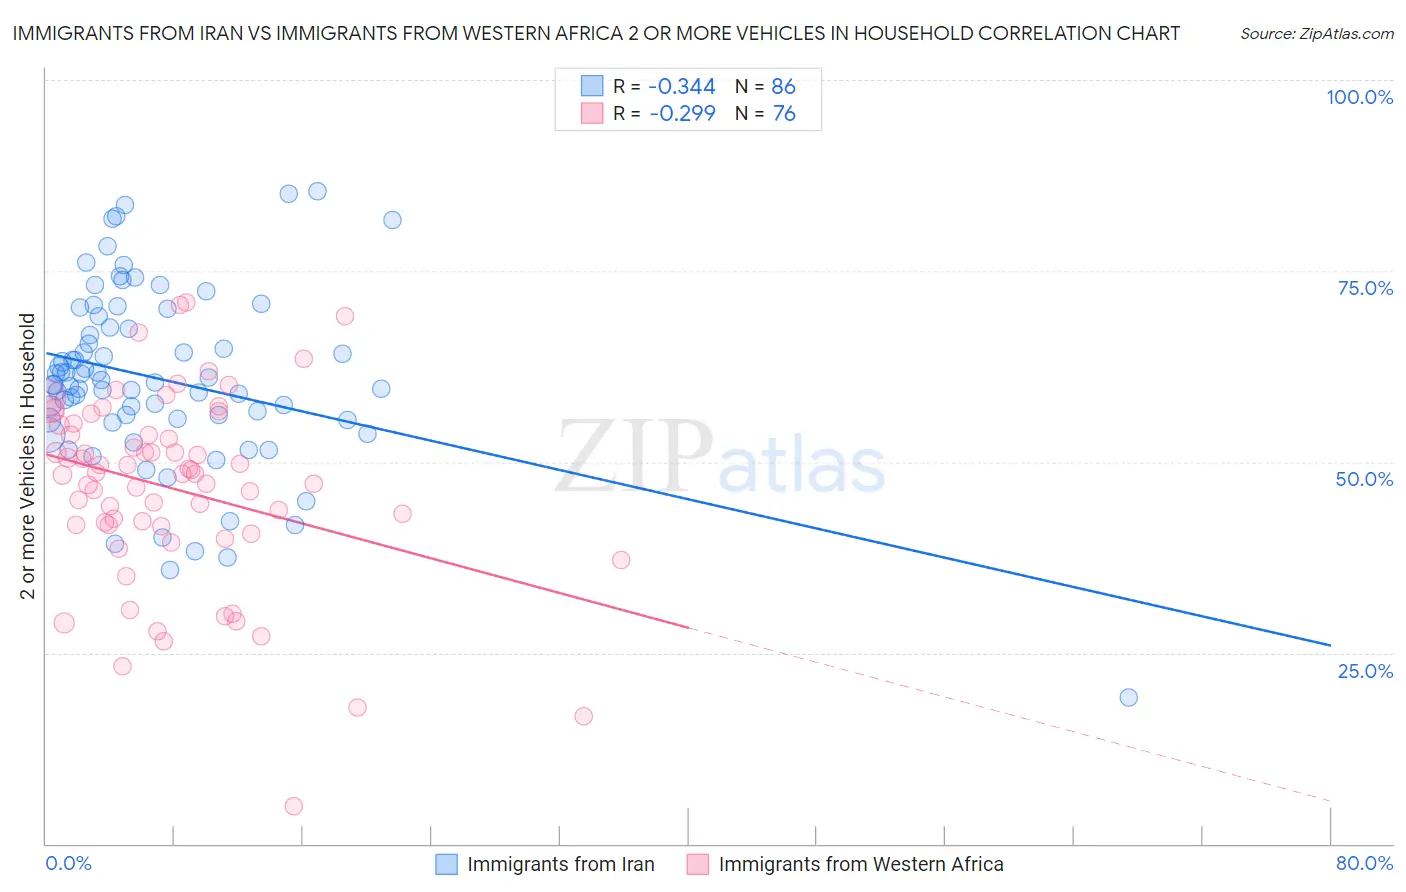
Immigrants from Iran vs Immigrants from Western Africa 2 or more Vehicles in Household
COMPARE
Immigrants from Iran
Immigrants from Western Africa
2 or more Vehicles in Household
2 or more Vehicles in Household Comparison
Immigrants from Iran
Immigrants from Western Africa
57.9%
2 OR MORE VEHICLES IN HOUSEHOLD
99.1/ 100
METRIC RATING
88th/ 347
METRIC RANK
49.4%
2 OR MORE VEHICLES IN HOUSEHOLD
0.0/ 100
METRIC RATING
305th/ 347
METRIC RANK
Immigrants from Iran vs Immigrants from Western Africa 2 or more Vehicles in Household Correlation Chart
The statistical analysis conducted on geographies consisting of 279,850,243 people shows a mild negative correlation between the proportion of Immigrants from Iran and percentage of households with 2 or more vehicles available in the United States with a correlation coefficient (R) of -0.344 and weighted average of 57.9%. Similarly, the statistical analysis conducted on geographies consisting of 357,581,747 people shows a weak negative correlation between the proportion of Immigrants from Western Africa and percentage of households with 2 or more vehicles available in the United States with a correlation coefficient (R) of -0.299 and weighted average of 49.4%, a difference of 17.4%.
2 or more Vehicles in Household Correlation Summary
| Measurement | Immigrants from Iran | Immigrants from Western Africa |
| Minimum | 19.2% | 4.9% |
| Maximum | 85.4% | 70.9% |
| Range | 66.2% | 66.0% |
| Mean | 60.8% | 46.5% |
| Median | 60.2% | 48.5% |
| Interquartile 25% (IQ1) | 55.5% | 41.6% |
| Interquartile 75% (IQ3) | 67.5% | 54.2% |
| Interquartile Range (IQR) | 12.0% | 12.6% |
| Standard Deviation (Sample) | 11.9% | 12.5% |
| Standard Deviation (Population) | 11.8% | 12.4% |
Similar Demographics by 2 or more Vehicles in Household
Demographics Similar to Immigrants from Iran by 2 or more Vehicles in Household
In terms of 2 or more vehicles in household, the demographic groups most similar to Immigrants from Iran are Thai (57.9%, a difference of 0.010%), Potawatomi (58.0%, a difference of 0.050%), Immigrants from Germany (57.9%, a difference of 0.070%), Hispanic or Latino (57.9%, a difference of 0.070%), and Slovak (58.0%, a difference of 0.080%).
| Demographics | Rating | Rank | 2 or more Vehicles in Household |
| Immigrants | Iraq | 99.3 /100 | #81 | Exceptional 58.1% |
| Iranians | 99.3 /100 | #82 | Exceptional 58.1% |
| Icelanders | 99.2 /100 | #83 | Exceptional 58.0% |
| Maltese | 99.2 /100 | #84 | Exceptional 58.0% |
| Slovaks | 99.2 /100 | #85 | Exceptional 58.0% |
| Potawatomi | 99.1 /100 | #86 | Exceptional 58.0% |
| Thais | 99.1 /100 | #87 | Exceptional 57.9% |
| Immigrants | Iran | 99.1 /100 | #88 | Exceptional 57.9% |
| Immigrants | Germany | 99.0 /100 | #89 | Exceptional 57.9% |
| Hispanics or Latinos | 99.0 /100 | #90 | Exceptional 57.9% |
| Pakistanis | 99.0 /100 | #91 | Exceptional 57.9% |
| Shoshone | 99.0 /100 | #92 | Exceptional 57.9% |
| Ottawa | 99.0 /100 | #93 | Exceptional 57.9% |
| Filipinos | 98.9 /100 | #94 | Exceptional 57.8% |
| Hmong | 98.9 /100 | #95 | Exceptional 57.8% |
Demographics Similar to Immigrants from Western Africa by 2 or more Vehicles in Household
In terms of 2 or more vehicles in household, the demographic groups most similar to Immigrants from Western Africa are Immigrants from Israel (49.2%, a difference of 0.26%), Hopi (49.0%, a difference of 0.69%), Albanian (49.0%, a difference of 0.76%), Immigrants from Belize (49.9%, a difference of 1.1%), and Moroccan (48.8%, a difference of 1.1%).
| Demographics | Rating | Rank | 2 or more Vehicles in Household |
| Paraguayans | 0.0 /100 | #298 | Tragic 50.3% |
| Immigrants | Morocco | 0.0 /100 | #299 | Tragic 50.3% |
| Immigrants | Russia | 0.0 /100 | #300 | Tragic 50.3% |
| Immigrants | Greece | 0.0 /100 | #301 | Tragic 50.2% |
| Immigrants | South America | 0.0 /100 | #302 | Tragic 50.2% |
| Tohono O'odham | 0.0 /100 | #303 | Tragic 50.0% |
| Immigrants | Belize | 0.0 /100 | #304 | Tragic 49.9% |
| Immigrants | Western Africa | 0.0 /100 | #305 | Tragic 49.4% |
| Immigrants | Israel | 0.0 /100 | #306 | Tragic 49.2% |
| Hopi | 0.0 /100 | #307 | Tragic 49.0% |
| Albanians | 0.0 /100 | #308 | Tragic 49.0% |
| Moroccans | 0.0 /100 | #309 | Tragic 48.8% |
| Ghanaians | 0.0 /100 | #310 | Tragic 48.0% |
| Immigrants | Belarus | 0.0 /100 | #311 | Tragic 47.9% |
| Haitians | 0.0 /100 | #312 | Tragic 47.6% |