Immigrants from Argentina vs Puget Sound Salish 2 or more Vehicles in Household
COMPARE
Immigrants from Argentina
Puget Sound Salish
2 or more Vehicles in Household
2 or more Vehicles in Household Comparison
Immigrants from Argentina
Puget Sound Salish
53.9%
2 OR MORE VEHICLES IN HOUSEHOLD
6.8/ 100
METRIC RATING
218th/ 347
METRIC RANK
62.1%
2 OR MORE VEHICLES IN HOUSEHOLD
100.0/ 100
METRIC RATING
7th/ 347
METRIC RANK
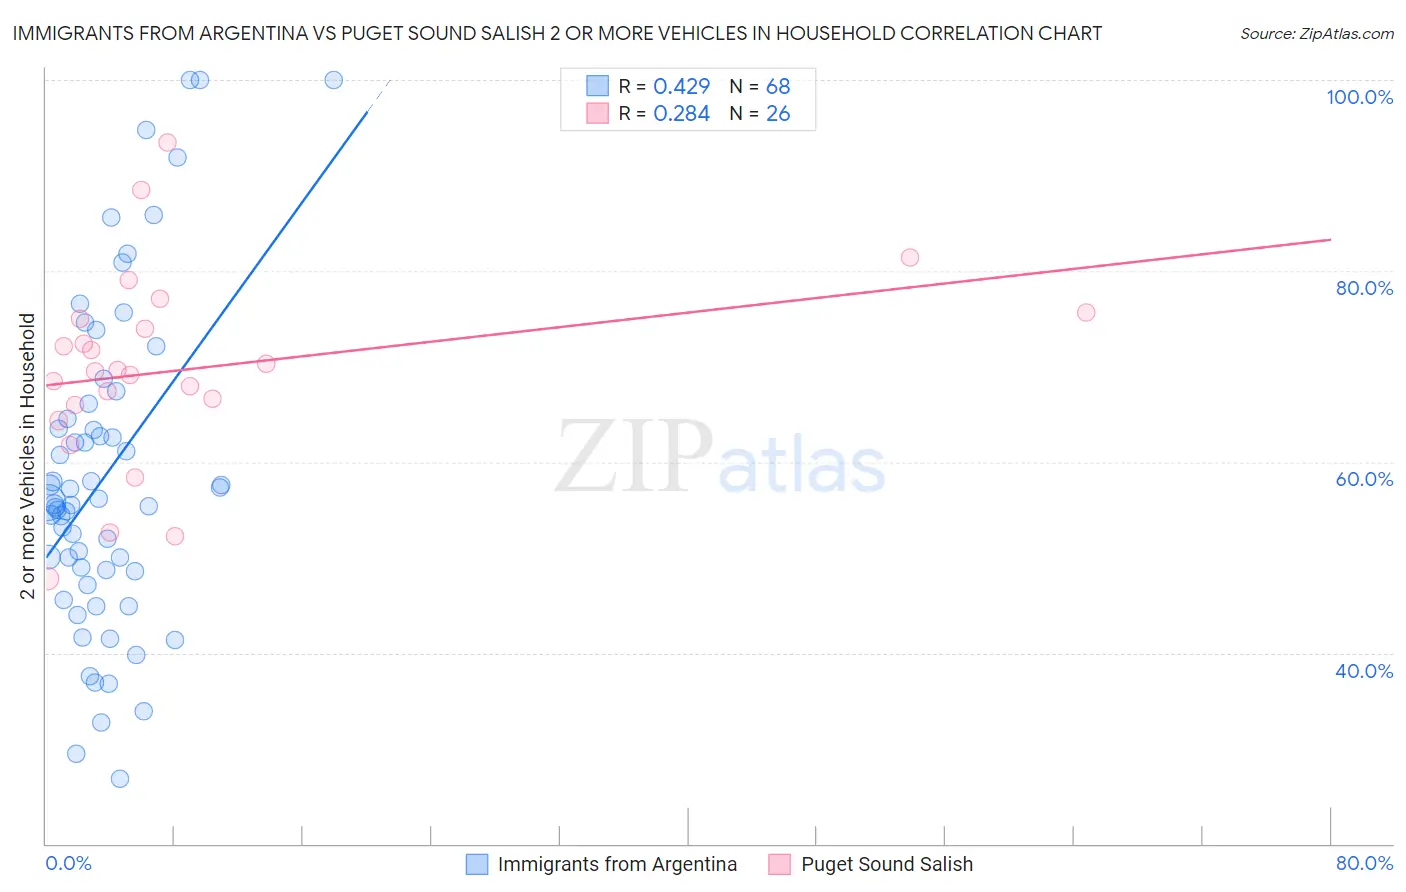
Immigrants from Argentina vs Puget Sound Salish 2 or more Vehicles in Household Correlation Chart
The statistical analysis conducted on geographies consisting of 264,362,205 people shows a moderate positive correlation between the proportion of Immigrants from Argentina and percentage of households with 2 or more vehicles available in the United States with a correlation coefficient (R) of 0.429 and weighted average of 53.9%. Similarly, the statistical analysis conducted on geographies consisting of 46,155,865 people shows a weak positive correlation between the proportion of Puget Sound Salish and percentage of households with 2 or more vehicles available in the United States with a correlation coefficient (R) of 0.284 and weighted average of 62.1%, a difference of 15.1%.
2 or more Vehicles in Household Correlation Summary
| Measurement | Immigrants from Argentina | Puget Sound Salish |
| Minimum | 26.8% | 47.8% |
| Maximum | 100.0% | 93.4% |
| Range | 73.2% | 45.6% |
| Mean | 58.6% | 69.7% |
| Median | 55.6% | 69.6% |
| Interquartile 25% (IQ1) | 48.6% | 66.0% |
| Interquartile 75% (IQ3) | 65.3% | 75.0% |
| Interquartile Range (IQR) | 16.6% | 9.0% |
| Standard Deviation (Sample) | 16.9% | 10.3% |
| Standard Deviation (Population) | 16.8% | 10.1% |
Similar Demographics by 2 or more Vehicles in Household
Demographics Similar to Immigrants from Argentina by 2 or more Vehicles in Household
In terms of 2 or more vehicles in household, the demographic groups most similar to Immigrants from Argentina are Immigrants from Burma/Myanmar (53.9%, a difference of 0.050%), South American Indian (53.9%, a difference of 0.060%), Taiwanese (53.9%, a difference of 0.080%), Immigrants from Singapore (53.9%, a difference of 0.10%), and Kiowa (53.9%, a difference of 0.11%).
| Demographics | Rating | Rank | 2 or more Vehicles in Household |
| Immigrants | Hungary | 11.3 /100 | #211 | Poor 54.2% |
| Immigrants | Chile | 11.1 /100 | #212 | Poor 54.2% |
| Guatemalans | 9.6 /100 | #213 | Tragic 54.1% |
| Immigrants | Czechoslovakia | 9.4 /100 | #214 | Tragic 54.1% |
| Aleuts | 9.3 /100 | #215 | Tragic 54.1% |
| Immigrants | Western Asia | 9.3 /100 | #216 | Tragic 54.1% |
| Immigrants | Burma/Myanmar | 7.1 /100 | #217 | Tragic 53.9% |
| Immigrants | Argentina | 6.8 /100 | #218 | Tragic 53.9% |
| South American Indians | 6.5 /100 | #219 | Tragic 53.9% |
| Taiwanese | 6.3 /100 | #220 | Tragic 53.9% |
| Immigrants | Singapore | 6.3 /100 | #221 | Tragic 53.9% |
| Kiowa | 6.2 /100 | #222 | Tragic 53.9% |
| Immigrants | Bosnia and Herzegovina | 5.5 /100 | #223 | Tragic 53.8% |
| Brazilians | 5.3 /100 | #224 | Tragic 53.8% |
| Immigrants | Egypt | 5.2 /100 | #225 | Tragic 53.8% |
Demographics Similar to Puget Sound Salish by 2 or more Vehicles in Household
In terms of 2 or more vehicles in household, the demographic groups most similar to Puget Sound Salish are Scandinavian (62.1%, a difference of 0.060%), English (61.9%, a difference of 0.27%), Swedish (61.8%, a difference of 0.34%), Immigrants from Fiji (62.3%, a difference of 0.40%), and Mexican (61.7%, a difference of 0.62%).
| Demographics | Rating | Rank | 2 or more Vehicles in Household |
| Yakama | 100.0 /100 | #1 | Exceptional 64.9% |
| Tongans | 100.0 /100 | #2 | Exceptional 63.5% |
| Danes | 100.0 /100 | #3 | Exceptional 63.3% |
| Norwegians | 100.0 /100 | #4 | Exceptional 62.8% |
| Immigrants | Fiji | 100.0 /100 | #5 | Exceptional 62.3% |
| Scandinavians | 100.0 /100 | #6 | Exceptional 62.1% |
| Puget Sound Salish | 100.0 /100 | #7 | Exceptional 62.1% |
| English | 100.0 /100 | #8 | Exceptional 61.9% |
| Swedes | 100.0 /100 | #9 | Exceptional 61.8% |
| Mexicans | 100.0 /100 | #10 | Exceptional 61.7% |
| Dutch | 100.0 /100 | #11 | Exceptional 61.6% |
| Germans | 100.0 /100 | #12 | Exceptional 61.6% |
| Samoans | 100.0 /100 | #13 | Exceptional 61.5% |
| Czechs | 100.0 /100 | #14 | Exceptional 61.5% |
| Nepalese | 100.0 /100 | #15 | Exceptional 61.4% |