Zip Codes with the Highest Percentage of Population Employed in Architecture & Engineering in Falls Church, VA
RELATED REPORTS & OPTIONS
Architecture & Engineering
Falls Church
Compare Zip Codes
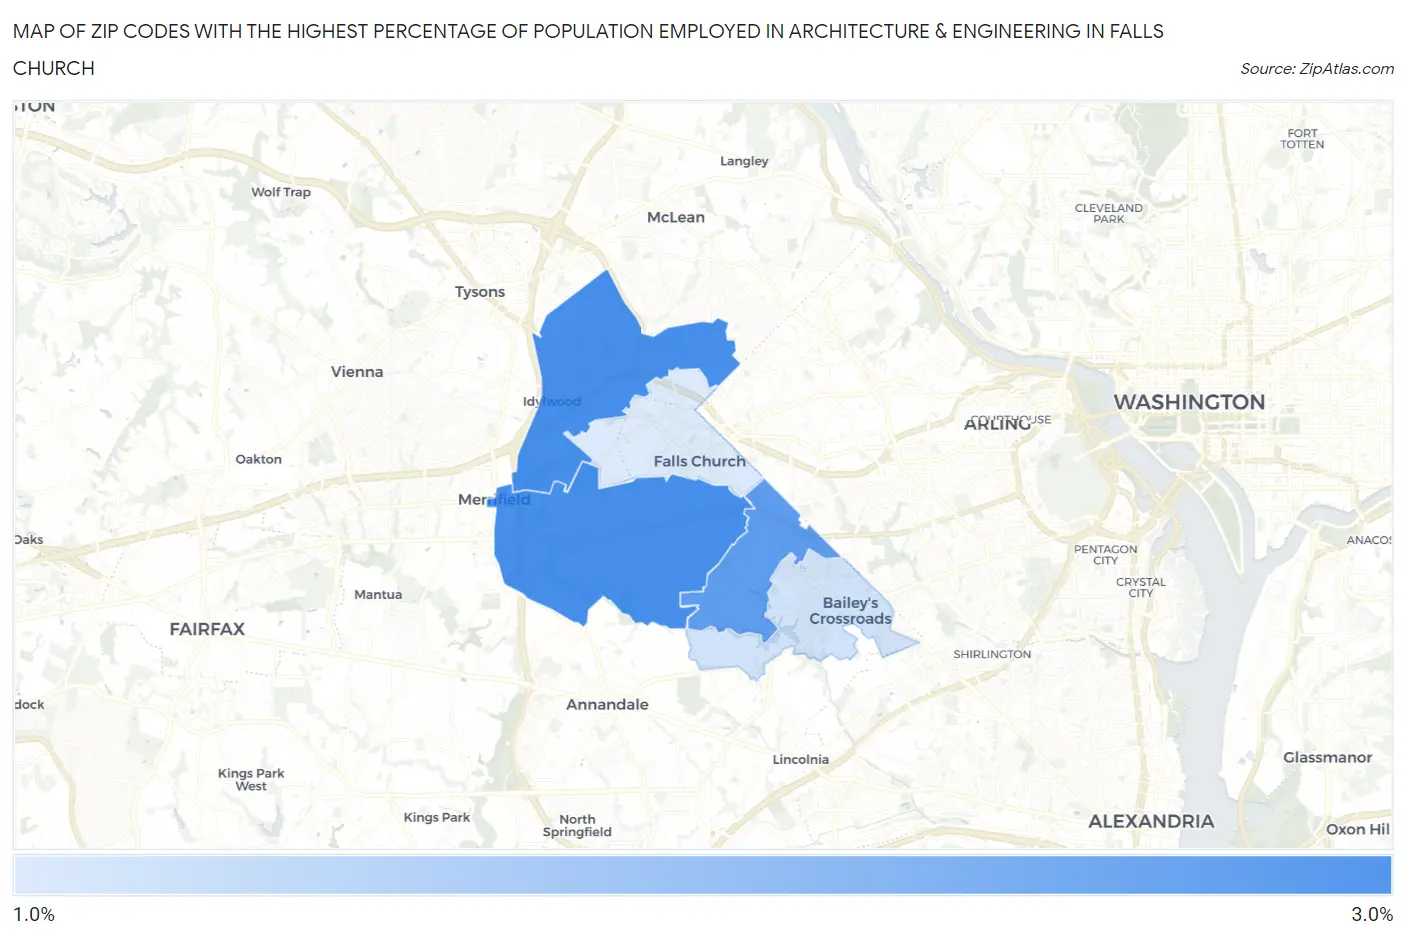
Map of Zip Codes with the Highest Percentage of Population Employed in Architecture & Engineering in Falls Church
0.0%
3.0%
Zip Codes with the Highest Percentage of Population Employed in Architecture & Engineering in Falls Church, VA
| Zip Code | % Employed | vs State | vs National | |
| 1. | 22042 | 2.5% | 2.3%(+0.233)#202 | 2.1%(+0.389)#6,846 |
| 2. | 22043 | 2.5% | 2.3%(+0.231)#203 | 2.1%(+0.387)#6,852 |
| 3. | 22044 | 2.4% | 2.3%(+0.127)#219 | 2.1%(+0.283)#7,326 |
| 4. | 22041 | 1.9% | 2.3%(-0.406)#297 | 2.1%(-0.250)#10,252 |
| 5. | 22046 | 1.8% | 2.3%(-0.458)#304 | 2.1%(-0.303)#10,569 |
1
Common Questions
What are the Top 3 Zip Codes with the Highest Percentage of Population Employed in Architecture & Engineering in Falls Church, VA?
Top 3 Zip Codes with the Highest Percentage of Population Employed in Architecture & Engineering in Falls Church, VA are:
What zip code has the Highest Percentage of Population Employed in Architecture & Engineering in Falls Church, VA?
22042 has the Highest Percentage of Population Employed in Architecture & Engineering in Falls Church, VA with 2.5%.
What is the Percentage of Population Employed in Architecture & Engineering in Falls Church, VA?
Percentage of Population Employed in Architecture & Engineering in Falls Church is 1.9%.
What is the Percentage of Population Employed in Architecture & Engineering in Virginia?
Percentage of Population Employed in Architecture & Engineering in Virginia is 2.3%.
What is the Percentage of Population Employed in Architecture & Engineering in the United States?
Percentage of Population Employed in Architecture & Engineering in the United States is 2.1%.