Swedish vs Immigrants from Germany Unemployment Among Women with Children Ages 6 to 17 years

COMPARE

Swedish
Race
Ancestry
AfghanAfricanAlaska NativeAlaskan AthabascanAlbanianAleutAlsatianAmericanApacheArabArapahoArgentineanArmenianAssyrian/Chaldean/SyriacAustralianAustrianBahamianBangladeshiBarbadianBasqueBelgianBelizeanBermudanBhutaneseBlackfeetBolivianBrazilianBritishBritish West IndianBulgarianBurmeseCajunCambodianCanadianCape VerdeanCarpatho RusynCelticCentral AmericanCentral American IndianCherokeeCheyenneChickasawChileanChineseChippewaChoctawColombianColvilleComancheCosta RicanCreeCreekCroatianCrowCubanCypriotCzechCzechoslovakianDanishDelawareDominicanDutchDutch West IndianEastern EuropeanEcuadorianEgyptianEnglishEstonianEthiopianEuropeanFijianFilipinoFinnishFrenchFrench American IndianFrench CanadianGermanGerman RussianGhanaianGreekGuamanian/ChamorroGuatemalanGuyaneseHaitianHmongHonduranHopiHoumaHungarianIcelanderIndian (Asian)IndonesianInupiatIranianIraqiIrishIroquoisIsraeliItalianJamaicanJapaneseJordanianKenyanKiowaKoreanLaotianLatvianLebaneseLiberianLithuanianLumbeeLuxembourgerMacedonianMalaysianMalteseMarshalleseMenomineeMexicanMexican American IndianMongolianMoroccanNative HawaiianNavajoNepaleseNew ZealanderNicaraguanNigerianNorthern EuropeanNorwegianOkinawanOsageOttawaPaiutePakistaniPalestinianPanamanianParaguayanPennsylvania GermanPeruvianPimaPolishPortuguesePotawatomiPuebloPuerto RicanPuget Sound SalishRomanianRussianSalvadoranSamoanScandinavianScotch-IrishScottishSeminoleSenegaleseSerbianShoshoneSierra LeoneanSiouxSlavicSlovakSloveneSomaliSouth AfricanSouth AmericanSouth American IndianSoviet UnionSpaniardSpanishSpanish AmericanSpanish American IndianSri LankanSubsaharan AfricanSudaneseSwedishSwissSyrianTaiwaneseThaiTlingit-HaidaTohono O'OdhamTonganTrinidadian and TobagonianTsimshianTurkishU.S. Virgin IslanderUgandanUkrainianUruguayanUteVenezuelanVietnameseWelshWest IndianYakamaYaquiYugoslavianYumanYup'ikZimbabwean
Immigration
NonimmigrantsImmigrantsAfghanistanAfricaAlbaniaArgentinaArmeniaAsiaAustraliaAustriaBahamasBangladeshBarbadosBelarusBelgiumBelizeBoliviaBosnia and HerzegovinaBrazilBulgariaBurma/MyanmarCabo VerdeCambodiaCameroonCanadaCaribbeanCentral AmericaChileChinaColombiaCongoCosta RicaCroatiaCubaCzechoslovakiaDenmarkDominicaDominican RepublicEastern AfricaEastern AsiaEastern EuropeEcuadorEgyptEl SalvadorEnglandEritreaEthiopiaEuropeFijiFranceGhanaGreeceGrenadaGuatemalaGuyanaHaitiHondurasHong KongHungaryIndiaIndonesiaIranIraqIrelandIsraelItalyJamaicaJapanJordanKazakhstanKenyaKoreaKuwaitLaosLatin AmericaLatviaLebanonLiberiaLithuaniaMalaysiaMexicoMicronesiaMiddle AfricaMoldovaMoroccoNepalNetherlandsNicaraguaNigeriaNorth AmericaNorth MacedoniaNorthern AfricaNorthern EuropeNorwayOceaniaPakistanPanamaPeruPhilippinesPolandPortugalRomaniaRussiaSaudi ArabiaScotlandSenegalSerbiaSierra LeoneSingaporeSomaliaSouth AfricaSouth AmericaSouth Central AsiaSouth Eastern AsiaSouthern EuropeSpainSri LankaSt. Vincent and the GrenadinesSudanSwedenSwitzerlandSyriaTaiwanThailandTrinidad and TobagoTurkeyUgandaUkraineUruguayUzbekistanVenezuelaVietnamWest IndiesWestern AfricaWestern AsiaWestern EuropeYemenZaireZimbabweAzores
Immigrants from Germany
Race
Ancestry
AfghanAfricanAlaska NativeAlaskan AthabascanAlbanianAleutAlsatianAmericanApacheArabArapahoArgentineanArmenianAssyrian/Chaldean/SyriacAustralianAustrianBahamianBangladeshiBarbadianBasqueBelgianBelizeanBermudanBhutaneseBlackfeetBolivianBrazilianBritishBritish West IndianBulgarianBurmeseCajunCambodianCanadianCape VerdeanCarpatho RusynCelticCentral AmericanCentral American IndianCherokeeCheyenneChickasawChileanChineseChippewaChoctawColombianColvilleComancheCosta RicanCreeCreekCroatianCrowCubanCypriotCzechCzechoslovakianDanishDelawareDominicanDutchDutch West IndianEastern EuropeanEcuadorianEgyptianEnglishEstonianEthiopianEuropeanFijianFilipinoFinnishFrenchFrench American IndianFrench CanadianGermanGerman RussianGhanaianGreekGuamanian/ChamorroGuatemalanGuyaneseHaitianHmongHonduranHopiHoumaHungarianIcelanderIndian (Asian)IndonesianInupiatIranianIraqiIrishIroquoisIsraeliItalianJamaicanJapaneseJordanianKenyanKiowaKoreanLaotianLatvianLebaneseLiberianLithuanianLumbeeLuxembourgerMacedonianMalaysianMalteseMarshalleseMenomineeMexicanMexican American IndianMongolianMoroccanNative HawaiianNavajoNepaleseNew ZealanderNicaraguanNigerianNorthern EuropeanNorwegianOkinawanOsageOttawaPaiutePakistaniPalestinianPanamanianParaguayanPennsylvania GermanPeruvianPimaPolishPortuguesePotawatomiPuebloPuerto RicanPuget Sound SalishRomanianRussianSalvadoranSamoanScandinavianScotch-IrishScottishSeminoleSenegaleseSerbianShoshoneSierra LeoneanSiouxSlavicSlovakSloveneSomaliSouth AfricanSouth AmericanSouth American IndianSoviet UnionSpaniardSpanishSpanish AmericanSpanish American IndianSri LankanSubsaharan AfricanSudaneseSwissSyrianTaiwaneseThaiTlingit-HaidaTohono O'OdhamTonganTrinidadian and TobagonianTsimshianTurkishU.S. Virgin IslanderUgandanUkrainianUruguayanUteVenezuelanVietnameseWelshWest IndianYakamaYaquiYugoslavianYumanYup'ikZimbabwean
Immigration
NonimmigrantsImmigrantsAfghanistanAfricaAlbaniaArgentinaArmeniaAsiaAustraliaAustriaBahamasBangladeshBarbadosBelarusBelgiumBelizeBoliviaBosnia and HerzegovinaBrazilBulgariaBurma/MyanmarCabo VerdeCambodiaCameroonCanadaCaribbeanCentral AmericaChileChinaColombiaCongoCosta RicaCroatiaCubaCzechoslovakiaDenmarkDominicaDominican RepublicEastern AfricaEastern AsiaEastern EuropeEcuadorEgyptEl SalvadorEnglandEritreaEthiopiaEuropeFijiFranceGermanyGhanaGreeceGrenadaGuatemalaGuyanaHaitiHondurasHong KongHungaryIndiaIndonesiaIranIraqIrelandIsraelItalyJamaicaJapanJordanKazakhstanKenyaKoreaKuwaitLaosLatin AmericaLatviaLebanonLiberiaLithuaniaMalaysiaMexicoMicronesiaMiddle AfricaMoldovaMoroccoNepalNetherlandsNicaraguaNigeriaNorth AmericaNorth MacedoniaNorthern AfricaNorthern EuropeNorwayOceaniaPakistanPanamaPeruPhilippinesPolandPortugalRomaniaRussiaSaudi ArabiaScotlandSenegalSerbiaSierra LeoneSingaporeSomaliaSouth AfricaSouth AmericaSouth Central AsiaSouth Eastern AsiaSouthern EuropeSpainSri LankaSt. Vincent and the GrenadinesSudanSwedenSwitzerlandSyriaTaiwanThailandTrinidad and TobagoTurkeyUgandaUkraineUruguayUzbekistanVenezuelaVietnamWest IndiesWestern AfricaWestern AsiaWestern EuropeYemenZaireZimbabweAzores
Unemployment Among Women with Children Ages 6 to 17 years
Income
Poverty
Unemployment
Labor Participation
Family Structure
Vehicle Availability
Education Level
Disability

Unemployment Among Women with Children Ages 6 to 17 years Comparison

Swedes

Immigrants from Germany

Exceptional
Tragic
8.6%
UNEMPLOYMENT AMONG WOMEN WITH CHILDREN AGES 6 TO 17 YEARS
97.6/ 100
METRIC RATING
108th/ 347
METRIC RANK
9.2%
UNEMPLOYMENT AMONG WOMEN WITH CHILDREN AGES 6 TO 17 YEARS
7.2/ 100
METRIC RATING
215th/ 347
METRIC RANK

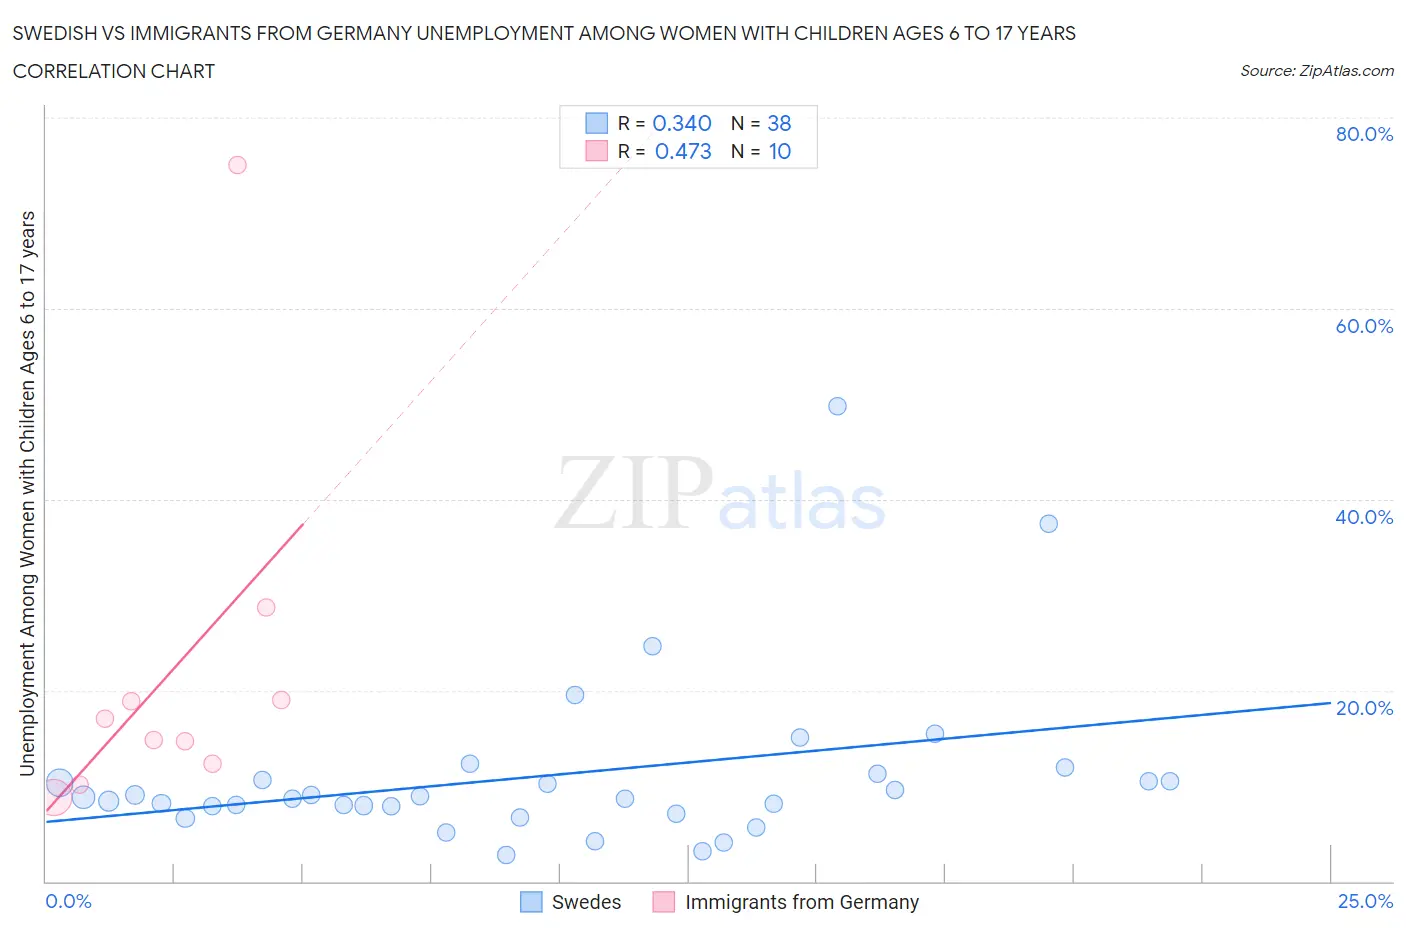
Swedish vs Immigrants from Germany Unemployment Among Women with Children Ages 6 to 17 years Correlation Chart

The statistical analysis conducted on geographies consisting of 343,411,572 people shows a mild positive correlation between the proportion of Swedes and unemployment rate among women with children between the ages 6 and 17 in the United States with a correlation coefficient (R) of 0.340 and weighted average of 8.6%. Similarly, the statistical analysis conducted on geographies consisting of 317,293,448 people shows a moderate positive correlation between the proportion of Immigrants from Germany and unemployment rate among women with children between the ages 6 and 17 in the United States with a correlation coefficient (R) of 0.473 and weighted average of 9.2%, a difference of 7.2%.
Swedish vs Immigrants from Germany Unemployment Among Women with Children Ages 6 to 17 years

Unemployment Among Women with Children Ages 6 to 17 years Correlation Summary

MeasurementSwedishImmigrants from Germany
Minimum2.8%8.7%
Maximum49.8%75.1%
Range47.0%66.3%
Mean11.1%21.9%
Median8.7%15.9%
Interquartile 25% (IQ1)7.9%12.3%
Interquartile 75% (IQ3)10.6%19.0%
Interquartile Range (IQR)2.7%6.7%
Standard Deviation (Sample)8.9%19.5%
Standard Deviation (Population)8.8%18.5%

Similar Demographics by Unemployment Among Women with Children Ages 6 to 17 years

Demographics Similar to Swedes by Unemployment Among Women with Children Ages 6 to 17 years

In terms of unemployment among women with children ages 6 to 17 years, the demographic groups most similar to Swedes are Chickasaw (8.6%, a difference of 0.010%), Immigrants from Serbia (8.6%, a difference of 0.040%), Immigrants from Romania (8.6%, a difference of 0.070%), Immigrants from Norway (8.6%, a difference of 0.080%), and Latvian (8.6%, a difference of 0.080%).
DemographicsRating | RankUnemployment Among Women with Children Ages 6 to 17 years
Immigrants | Pakistan
98.4
/100
|
#101
Exceptional
8.6%
Immigrants | South Africa
98.3
/100
|
#102
Exceptional
8.6%
Scandinavians
98.3
/100
|
#103
Exceptional
8.6%
Immigrants | France
98.0
/100
|
#104
Exceptional
8.6%
Immigrants | Norway
97.8
/100
|
#105
Exceptional
8.6%
Immigrants | Serbia
97.7
/100
|
#106
Exceptional
8.6%
Chickasaw
97.6
/100
|
#107
Exceptional
8.6%
Swedes
97.6
/100
|
#108
Exceptional
8.6%
Immigrants | Romania
97.5
/100
|
#109
Exceptional
8.6%
Latvians
97.4
/100
|
#110
Exceptional
8.6%
Immigrants | Ukraine
97.4
/100
|
#111
Exceptional
8.6%
Romanians
97.1
/100
|
#112
Exceptional
8.6%
Eastern Europeans
96.8
/100
|
#113
Exceptional
8.6%
Immigrants | Russia
96.7
/100
|
#114
Exceptional
8.6%
Argentineans
96.5
/100
|
#115
Exceptional
8.6%

Demographics Similar to Immigrants from Germany by Unemployment Among Women with Children Ages 6 to 17 years

In terms of unemployment among women with children ages 6 to 17 years, the demographic groups most similar to Immigrants from Germany are Immigrants from Uruguay (9.2%, a difference of 0.0%), German (9.2%, a difference of 0.010%), Iroquois (9.2%, a difference of 0.040%), Syrian (9.2%, a difference of 0.060%), and Immigrants from Scotland (9.2%, a difference of 0.11%).
DemographicsRating | RankUnemployment Among Women with Children Ages 6 to 17 years
Immigrants | Peru
10.8
/100
|
#208
Poor
9.2%
Salvadorans
10.7
/100
|
#209
Poor
9.2%
Finns
10.0
/100
|
#210
Tragic
9.2%
Immigrants | Cuba
9.6
/100
|
#211
Tragic
9.2%
Peruvians
9.0
/100
|
#212
Tragic
9.2%
Spaniards
8.2
/100
|
#213
Tragic
9.2%
Iroquois
7.5
/100
|
#214
Tragic
9.2%
Immigrants | Germany
7.2
/100
|
#215
Tragic
9.2%
Immigrants | Uruguay
7.2
/100
|
#216
Tragic
9.2%
Germans
7.2
/100
|
#217
Tragic
9.2%
Syrians
6.9
/100
|
#218
Tragic
9.2%
Immigrants | Scotland
6.6
/100
|
#219
Tragic
9.2%
Belgians
6.4
/100
|
#220
Tragic
9.2%
Crow
5.8
/100
|
#221
Tragic
9.2%
Immigrants | Southern Europe
5.8
/100
|
#222
Tragic
9.2%