New Zealander vs Immigrants from Western Europe Unemployment Among Women with Children Ages 6 to 17 years
COMPARE
New Zealander
Immigrants from Western Europe
Unemployment Among Women with Children Ages 6 to 17 years
Unemployment Among Women with Children Ages 6 to 17 years Comparison
New Zealanders
Immigrants from Western Europe
8.6%
UNEMPLOYMENT AMONG WOMEN WITH CHILDREN AGES 6 TO 17 YEARS
98.4/ 100
METRIC RATING
100th/ 347
METRIC RANK
9.1%
UNEMPLOYMENT AMONG WOMEN WITH CHILDREN AGES 6 TO 17 YEARS
14.1/ 100
METRIC RATING
205th/ 347
METRIC RANK
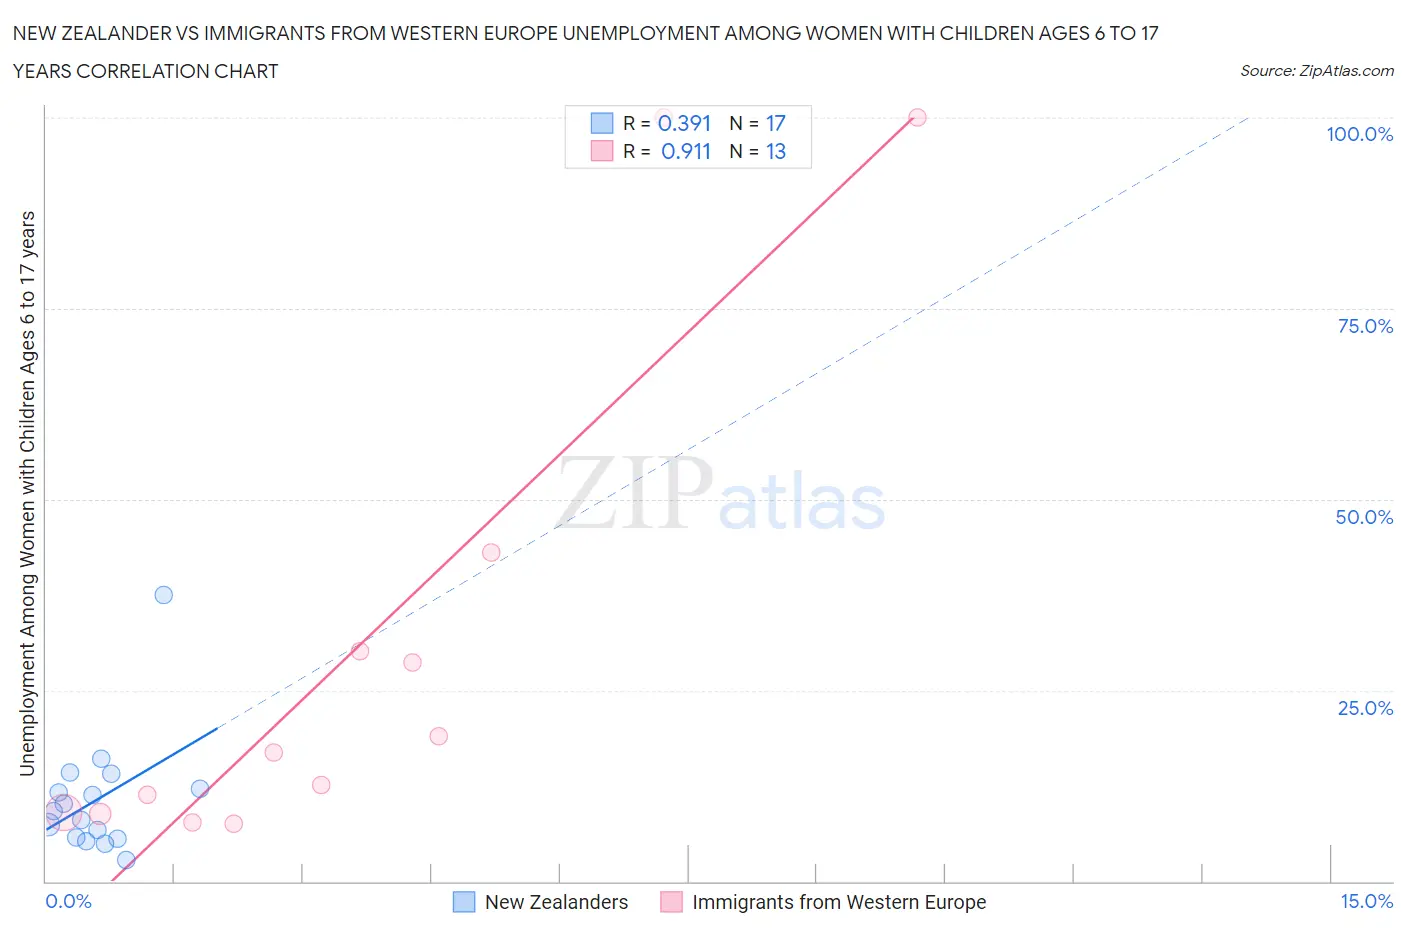
New Zealander vs Immigrants from Western Europe Unemployment Among Women with Children Ages 6 to 17 years Correlation Chart
The statistical analysis conducted on geographies consisting of 92,334,670 people shows a mild positive correlation between the proportion of New Zealanders and unemployment rate among women with children between the ages 6 and 17 in the United States with a correlation coefficient (R) of 0.391 and weighted average of 8.6%. Similarly, the statistical analysis conducted on geographies consisting of 331,705,739 people shows a near-perfect positive correlation between the proportion of Immigrants from Western Europe and unemployment rate among women with children between the ages 6 and 17 in the United States with a correlation coefficient (R) of 0.911 and weighted average of 9.1%, a difference of 6.9%.
Unemployment Among Women with Children Ages 6 to 17 years Correlation Summary
| Measurement | New Zealander | Immigrants from Western Europe |
| Minimum | 2.8% | 7.5% |
| Maximum | 37.5% | 100.0% |
| Range | 34.7% | 92.5% |
| Mean | 10.7% | 30.4% |
| Median | 9.1% | 16.8% |
| Interquartile 25% (IQ1) | 5.6% | 8.9% |
| Interquartile 75% (IQ3) | 13.1% | 36.5% |
| Interquartile Range (IQR) | 7.5% | 27.6% |
| Standard Deviation (Sample) | 7.9% | 32.7% |
| Standard Deviation (Population) | 7.6% | 31.4% |
Similar Demographics by Unemployment Among Women with Children Ages 6 to 17 years
Demographics Similar to New Zealanders by Unemployment Among Women with Children Ages 6 to 17 years
In terms of unemployment among women with children ages 6 to 17 years, the demographic groups most similar to New Zealanders are Immigrants from Lithuania (8.6%, a difference of 0.0%), Immigrants from Pakistan (8.6%, a difference of 0.0%), Immigrants from South Africa (8.6%, a difference of 0.030%), Scandinavian (8.6%, a difference of 0.040%), and Malaysian (8.6%, a difference of 0.080%).
| Demographics | Rating | Rank | Unemployment Among Women with Children Ages 6 to 17 years |
| Australians | 98.9 /100 | #93 | Exceptional 8.5% |
| Immigrants | Barbados | 98.8 /100 | #94 | Exceptional 8.5% |
| Sri Lankans | 98.7 /100 | #95 | Exceptional 8.5% |
| German Russians | 98.6 /100 | #96 | Exceptional 8.5% |
| Bolivians | 98.5 /100 | #97 | Exceptional 8.5% |
| Malaysians | 98.5 /100 | #98 | Exceptional 8.6% |
| Immigrants | Lithuania | 98.4 /100 | #99 | Exceptional 8.6% |
| New Zealanders | 98.4 /100 | #100 | Exceptional 8.6% |
| Immigrants | Pakistan | 98.4 /100 | #101 | Exceptional 8.6% |
| Immigrants | South Africa | 98.3 /100 | #102 | Exceptional 8.6% |
| Scandinavians | 98.3 /100 | #103 | Exceptional 8.6% |
| Immigrants | France | 98.0 /100 | #104 | Exceptional 8.6% |
| Immigrants | Norway | 97.8 /100 | #105 | Exceptional 8.6% |
| Immigrants | Serbia | 97.7 /100 | #106 | Exceptional 8.6% |
| Chickasaw | 97.6 /100 | #107 | Exceptional 8.6% |
Demographics Similar to Immigrants from Western Europe by Unemployment Among Women with Children Ages 6 to 17 years
In terms of unemployment among women with children ages 6 to 17 years, the demographic groups most similar to Immigrants from Western Europe are Immigrants from Canada (9.1%, a difference of 0.10%), Maltese (9.1%, a difference of 0.11%), Immigrants from Middle Africa (9.1%, a difference of 0.13%), Immigrants from North America (9.2%, a difference of 0.13%), and Immigrants from Trinidad and Tobago (9.1%, a difference of 0.22%).
| Demographics | Rating | Rank | Unemployment Among Women with Children Ages 6 to 17 years |
| Guyanese | 21.8 /100 | #198 | Fair 9.1% |
| Czechoslovakians | 20.8 /100 | #199 | Fair 9.1% |
| Trinidadians and Tobagonians | 18.2 /100 | #200 | Poor 9.1% |
| Immigrants | Trinidad and Tobago | 16.7 /100 | #201 | Poor 9.1% |
| Immigrants | Middle Africa | 15.6 /100 | #202 | Poor 9.1% |
| Maltese | 15.3 /100 | #203 | Poor 9.1% |
| Immigrants | Canada | 15.3 /100 | #204 | Poor 9.1% |
| Immigrants | Western Europe | 14.1 /100 | #205 | Poor 9.1% |
| Immigrants | North America | 12.7 /100 | #206 | Poor 9.2% |
| Cubans | 10.9 /100 | #207 | Poor 9.2% |
| Immigrants | Peru | 10.8 /100 | #208 | Poor 9.2% |
| Salvadorans | 10.7 /100 | #209 | Poor 9.2% |
| Finns | 10.0 /100 | #210 | Tragic 9.2% |
| Immigrants | Cuba | 9.6 /100 | #211 | Tragic 9.2% |
| Peruvians | 9.0 /100 | #212 | Tragic 9.2% |