Immigrants from Sweden vs Immigrants from Saudi Arabia Unemployment Among Women with Children Ages 6 to 17 years
COMPARE
Immigrants from Sweden
Immigrants from Saudi Arabia
Unemployment Among Women with Children Ages 6 to 17 years
Unemployment Among Women with Children Ages 6 to 17 years Comparison
Immigrants from Sweden
Immigrants from Saudi Arabia
8.1%
UNEMPLOYMENT AMONG WOMEN WITH CHILDREN AGES 6 TO 17 YEARS
100.0/ 100
METRIC RATING
44th/ 347
METRIC RANK
9.3%
UNEMPLOYMENT AMONG WOMEN WITH CHILDREN AGES 6 TO 17 YEARS
2.7/ 100
METRIC RATING
239th/ 347
METRIC RANK
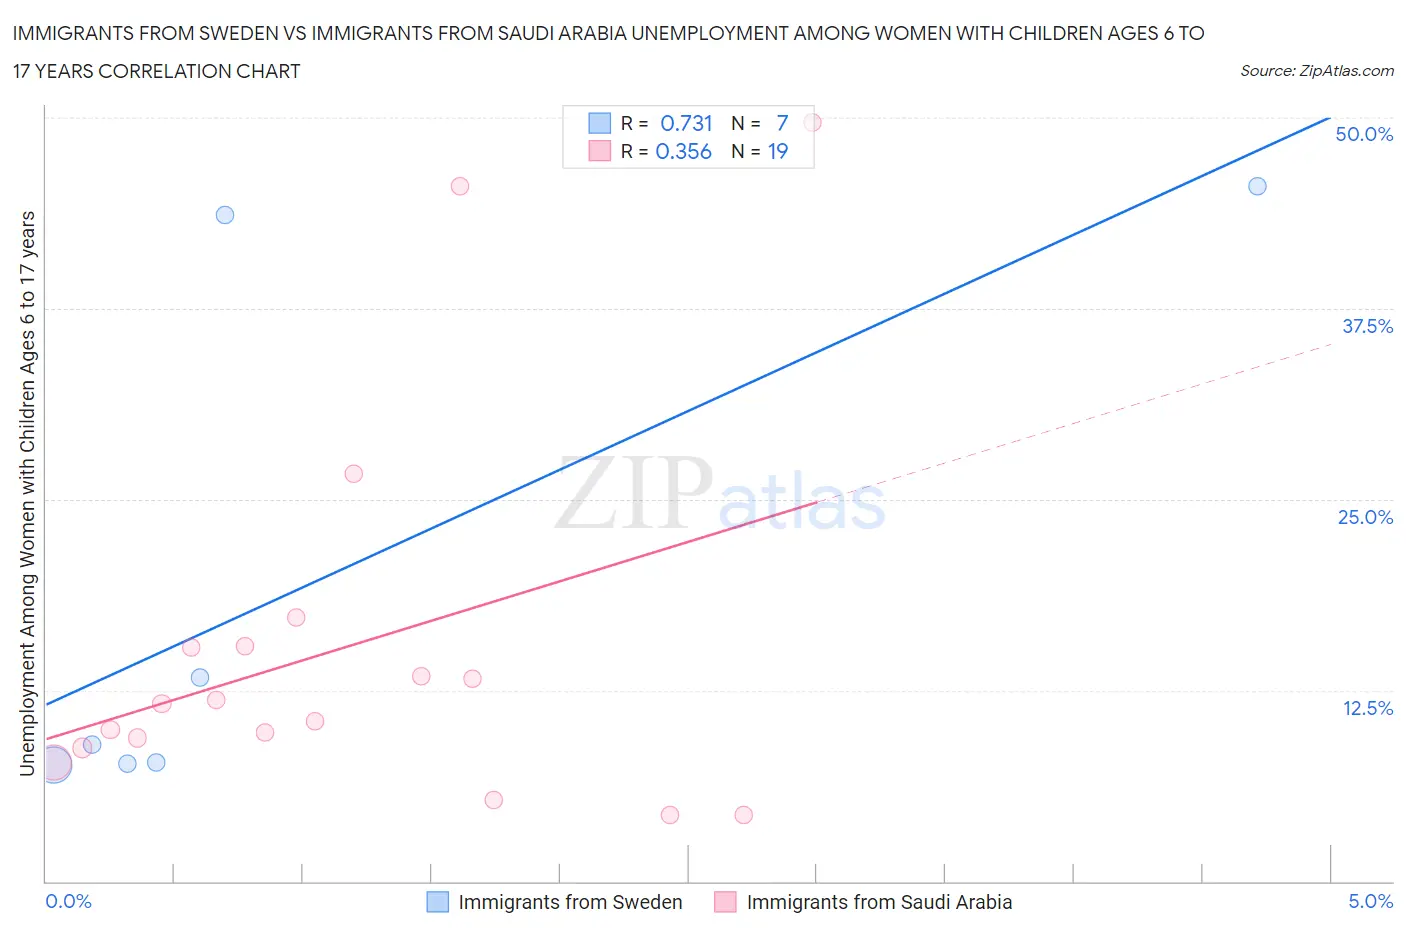
Immigrants from Sweden vs Immigrants from Saudi Arabia Unemployment Among Women with Children Ages 6 to 17 years Correlation Chart
The statistical analysis conducted on geographies consisting of 133,294,007 people shows a strong positive correlation between the proportion of Immigrants from Sweden and unemployment rate among women with children between the ages 6 and 17 in the United States with a correlation coefficient (R) of 0.731 and weighted average of 8.1%. Similarly, the statistical analysis conducted on geographies consisting of 135,443,902 people shows a mild positive correlation between the proportion of Immigrants from Saudi Arabia and unemployment rate among women with children between the ages 6 and 17 in the United States with a correlation coefficient (R) of 0.356 and weighted average of 9.3%, a difference of 15.7%.
Unemployment Among Women with Children Ages 6 to 17 years Correlation Summary
| Measurement | Immigrants from Sweden | Immigrants from Saudi Arabia |
| Minimum | 7.6% | 4.3% |
| Maximum | 45.5% | 49.7% |
| Range | 37.9% | 45.4% |
| Mean | 19.2% | 15.3% |
| Median | 8.9% | 11.6% |
| Interquartile 25% (IQ1) | 7.7% | 8.7% |
| Interquartile 75% (IQ3) | 43.6% | 15.4% |
| Interquartile Range (IQR) | 35.9% | 6.7% |
| Standard Deviation (Sample) | 17.4% | 12.5% |
| Standard Deviation (Population) | 16.1% | 12.2% |
Similar Demographics by Unemployment Among Women with Children Ages 6 to 17 years
Demographics Similar to Immigrants from Sweden by Unemployment Among Women with Children Ages 6 to 17 years
In terms of unemployment among women with children ages 6 to 17 years, the demographic groups most similar to Immigrants from Sweden are Bhutanese (8.1%, a difference of 0.040%), Immigrants from Bulgaria (8.1%, a difference of 0.050%), Icelander (8.1%, a difference of 0.060%), Immigrants from Switzerland (8.1%, a difference of 0.10%), and Immigrants from Somalia (8.0%, a difference of 0.18%).
| Demographics | Rating | Rank | Unemployment Among Women with Children Ages 6 to 17 years |
| Asians | 100.0 /100 | #37 | Exceptional 8.0% |
| Alsatians | 100.0 /100 | #38 | Exceptional 8.0% |
| Somalis | 100.0 /100 | #39 | Exceptional 8.0% |
| Immigrants | Zimbabwe | 100.0 /100 | #40 | Exceptional 8.0% |
| Iranians | 100.0 /100 | #41 | Exceptional 8.0% |
| Immigrants | Somalia | 100.0 /100 | #42 | Exceptional 8.0% |
| Bhutanese | 100.0 /100 | #43 | Exceptional 8.1% |
| Immigrants | Sweden | 100.0 /100 | #44 | Exceptional 8.1% |
| Immigrants | Bulgaria | 100.0 /100 | #45 | Exceptional 8.1% |
| Icelanders | 100.0 /100 | #46 | Exceptional 8.1% |
| Immigrants | Switzerland | 100.0 /100 | #47 | Exceptional 8.1% |
| Immigrants | Asia | 100.0 /100 | #48 | Exceptional 8.1% |
| Immigrants | Oceania | 100.0 /100 | #49 | Exceptional 8.1% |
| Hawaiians | 100.0 /100 | #50 | Exceptional 8.1% |
| Immigrants | Sudan | 100.0 /100 | #51 | Exceptional 8.1% |
Demographics Similar to Immigrants from Saudi Arabia by Unemployment Among Women with Children Ages 6 to 17 years
In terms of unemployment among women with children ages 6 to 17 years, the demographic groups most similar to Immigrants from Saudi Arabia are Arab (9.3%, a difference of 0.0%), Immigrants from Belize (9.3%, a difference of 0.080%), Hungarian (9.3%, a difference of 0.13%), Guatemalan (9.3%, a difference of 0.14%), and Uruguayan (9.3%, a difference of 0.15%).
| Demographics | Rating | Rank | Unemployment Among Women with Children Ages 6 to 17 years |
| French American Indians | 3.7 /100 | #232 | Tragic 9.3% |
| Immigrants | St. Vincent and the Grenadines | 3.3 /100 | #233 | Tragic 9.3% |
| Mexicans | 3.2 /100 | #234 | Tragic 9.3% |
| Uruguayans | 3.0 /100 | #235 | Tragic 9.3% |
| Hungarians | 3.0 /100 | #236 | Tragic 9.3% |
| Immigrants | Belize | 2.8 /100 | #237 | Tragic 9.3% |
| Arabs | 2.7 /100 | #238 | Tragic 9.3% |
| Immigrants | Saudi Arabia | 2.7 /100 | #239 | Tragic 9.3% |
| Guatemalans | 2.3 /100 | #240 | Tragic 9.3% |
| Colombians | 2.2 /100 | #241 | Tragic 9.3% |
| Immigrants | Colombia | 2.1 /100 | #242 | Tragic 9.3% |
| Scottish | 2.0 /100 | #243 | Tragic 9.4% |
| English | 1.9 /100 | #244 | Tragic 9.4% |
| Immigrants | Cameroon | 1.8 /100 | #245 | Tragic 9.4% |
| Immigrants | Africa | 1.6 /100 | #246 | Tragic 9.4% |