Immigrants from India vs Northern European Unemployment Among Women with Children Ages 6 to 17 years
COMPARE
Immigrants from India
Northern European
Unemployment Among Women with Children Ages 6 to 17 years
Unemployment Among Women with Children Ages 6 to 17 years Comparison
Immigrants from India
Northern Europeans
7.7%
UNEMPLOYMENT AMONG WOMEN WITH CHILDREN AGES 6 TO 17 YEARS
100.0/ 100
METRIC RATING
21st/ 347
METRIC RANK
8.8%
UNEMPLOYMENT AMONG WOMEN WITH CHILDREN AGES 6 TO 17 YEARS
89.2/ 100
METRIC RATING
139th/ 347
METRIC RANK
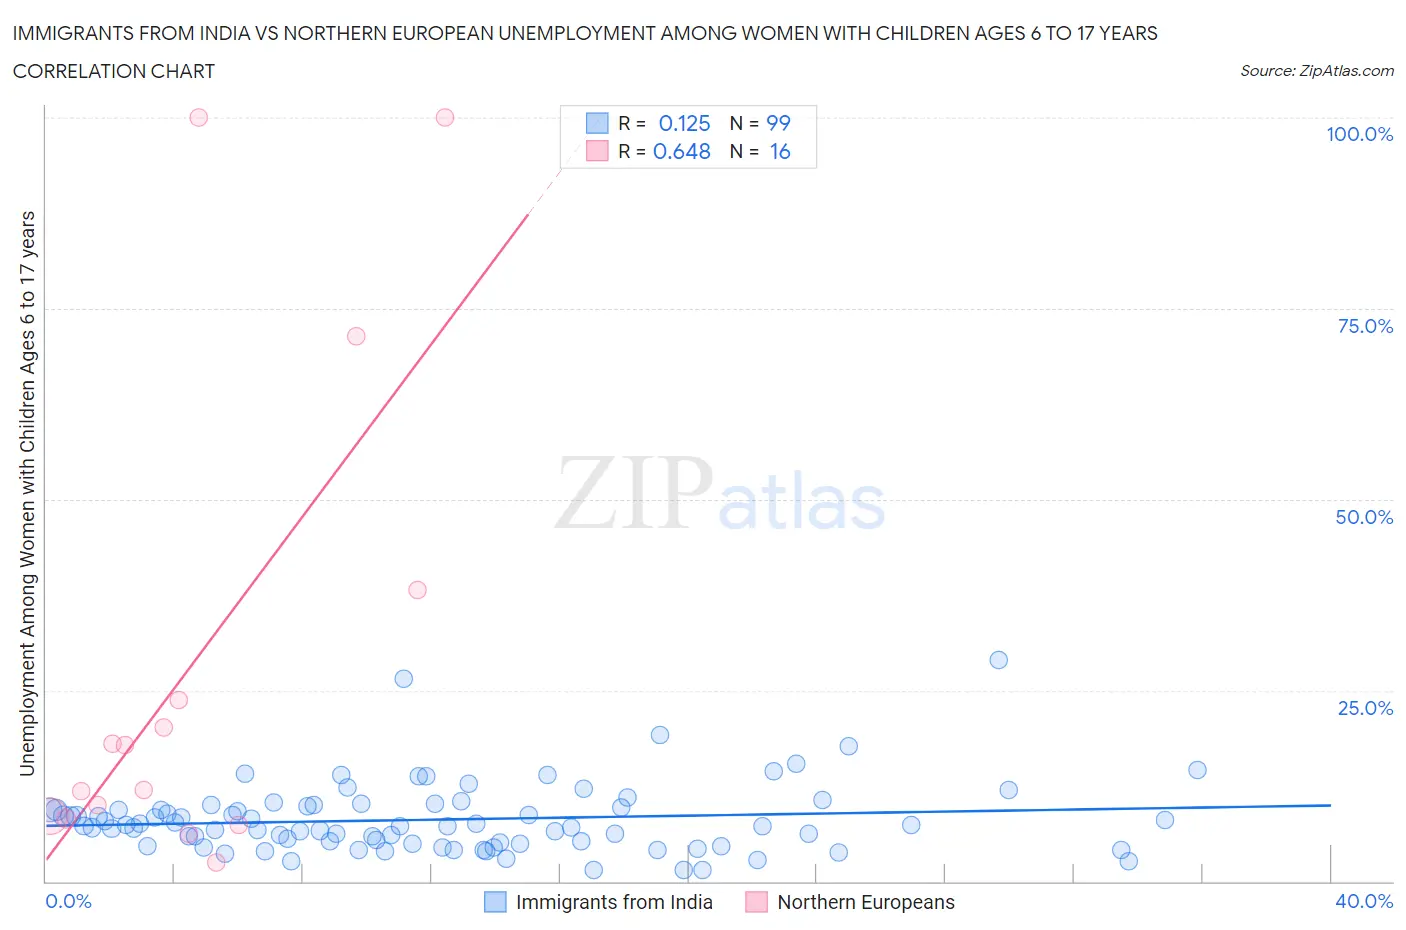
Immigrants from India vs Northern European Unemployment Among Women with Children Ages 6 to 17 years Correlation Chart
The statistical analysis conducted on geographies consisting of 305,099,511 people shows a poor positive correlation between the proportion of Immigrants from India and unemployment rate among women with children between the ages 6 and 17 in the United States with a correlation coefficient (R) of 0.125 and weighted average of 7.7%. Similarly, the statistical analysis conducted on geographies consisting of 279,656,078 people shows a significant positive correlation between the proportion of Northern Europeans and unemployment rate among women with children between the ages 6 and 17 in the United States with a correlation coefficient (R) of 0.648 and weighted average of 8.8%, a difference of 14.2%.
Unemployment Among Women with Children Ages 6 to 17 years Correlation Summary
| Measurement | Immigrants from India | Northern European |
| Minimum | 1.4% | 2.5% |
| Maximum | 28.9% | 100.0% |
| Range | 27.5% | 97.5% |
| Mean | 8.1% | 28.5% |
| Median | 7.2% | 14.8% |
| Interquartile 25% (IQ1) | 5.0% | 8.4% |
| Interquartile 75% (IQ3) | 9.8% | 30.9% |
| Interquartile Range (IQR) | 4.8% | 22.5% |
| Standard Deviation (Sample) | 4.5% | 32.5% |
| Standard Deviation (Population) | 4.5% | 31.4% |
Similar Demographics by Unemployment Among Women with Children Ages 6 to 17 years
Demographics Similar to Immigrants from India by Unemployment Among Women with Children Ages 6 to 17 years
In terms of unemployment among women with children ages 6 to 17 years, the demographic groups most similar to Immigrants from India are Immigrants from Singapore (7.7%, a difference of 0.13%), Immigrants from China (7.7%, a difference of 0.29%), Immigrants from Indonesia (7.7%, a difference of 0.68%), Nepalese (7.7%, a difference of 0.68%), and Immigrants from Eastern Asia (7.7%, a difference of 0.81%).
| Demographics | Rating | Rank | Unemployment Among Women with Children Ages 6 to 17 years |
| Sudanese | 100.0 /100 | #14 | Exceptional 7.4% |
| Puget Sound Salish | 100.0 /100 | #15 | Exceptional 7.5% |
| Immigrants | Burma/Myanmar | 100.0 /100 | #16 | Exceptional 7.5% |
| Cambodians | 100.0 /100 | #17 | Exceptional 7.5% |
| Afghans | 100.0 /100 | #18 | Exceptional 7.6% |
| Filipinos | 100.0 /100 | #19 | Exceptional 7.6% |
| Immigrants | Singapore | 100.0 /100 | #20 | Exceptional 7.7% |
| Immigrants | India | 100.0 /100 | #21 | Exceptional 7.7% |
| Immigrants | China | 100.0 /100 | #22 | Exceptional 7.7% |
| Immigrants | Indonesia | 100.0 /100 | #23 | Exceptional 7.7% |
| Nepalese | 100.0 /100 | #24 | Exceptional 7.7% |
| Immigrants | Eastern Asia | 100.0 /100 | #25 | Exceptional 7.7% |
| Indians (Asian) | 100.0 /100 | #26 | Exceptional 7.7% |
| Immigrants | Afghanistan | 100.0 /100 | #27 | Exceptional 7.8% |
| Immigrants | Uzbekistan | 100.0 /100 | #28 | Exceptional 7.8% |
Demographics Similar to Northern Europeans by Unemployment Among Women with Children Ages 6 to 17 years
In terms of unemployment among women with children ages 6 to 17 years, the demographic groups most similar to Northern Europeans are Immigrants from Ethiopia (8.8%, a difference of 0.030%), Immigrants from Argentina (8.7%, a difference of 0.090%), Immigrants from Poland (8.8%, a difference of 0.11%), Immigrants from Latvia (8.7%, a difference of 0.14%), and European (8.7%, a difference of 0.17%).
| Demographics | Rating | Rank | Unemployment Among Women with Children Ages 6 to 17 years |
| Yaqui | 92.2 /100 | #132 | Exceptional 8.7% |
| Egyptians | 91.8 /100 | #133 | Exceptional 8.7% |
| Immigrants | Ireland | 91.0 /100 | #134 | Exceptional 8.7% |
| Europeans | 90.6 /100 | #135 | Exceptional 8.7% |
| Immigrants | Latvia | 90.4 /100 | #136 | Exceptional 8.7% |
| Immigrants | Argentina | 90.0 /100 | #137 | Excellent 8.7% |
| Immigrants | Ethiopia | 89.5 /100 | #138 | Excellent 8.8% |
| Northern Europeans | 89.2 /100 | #139 | Excellent 8.8% |
| Immigrants | Poland | 88.3 /100 | #140 | Excellent 8.8% |
| Serbians | 87.6 /100 | #141 | Excellent 8.8% |
| Immigrants | Austria | 87.5 /100 | #142 | Excellent 8.8% |
| Immigrants | Kenya | 86.1 /100 | #143 | Excellent 8.8% |
| Russians | 85.8 /100 | #144 | Excellent 8.8% |
| Kenyans | 85.6 /100 | #145 | Excellent 8.8% |
| Chileans | 80.8 /100 | #146 | Excellent 8.8% |