Immigrants from Fiji vs Immigrants from Sweden Unemployment Among Women with Children Ages 6 to 17 years
COMPARE
Immigrants from Fiji
Immigrants from Sweden
Unemployment Among Women with Children Ages 6 to 17 years
Unemployment Among Women with Children Ages 6 to 17 years Comparison
Immigrants from Fiji
Immigrants from Sweden
7.3%
UNEMPLOYMENT AMONG WOMEN WITH CHILDREN AGES 6 TO 17 YEARS
100.0/ 100
METRIC RATING
10th/ 347
METRIC RANK
8.1%
UNEMPLOYMENT AMONG WOMEN WITH CHILDREN AGES 6 TO 17 YEARS
100.0/ 100
METRIC RATING
44th/ 347
METRIC RANK
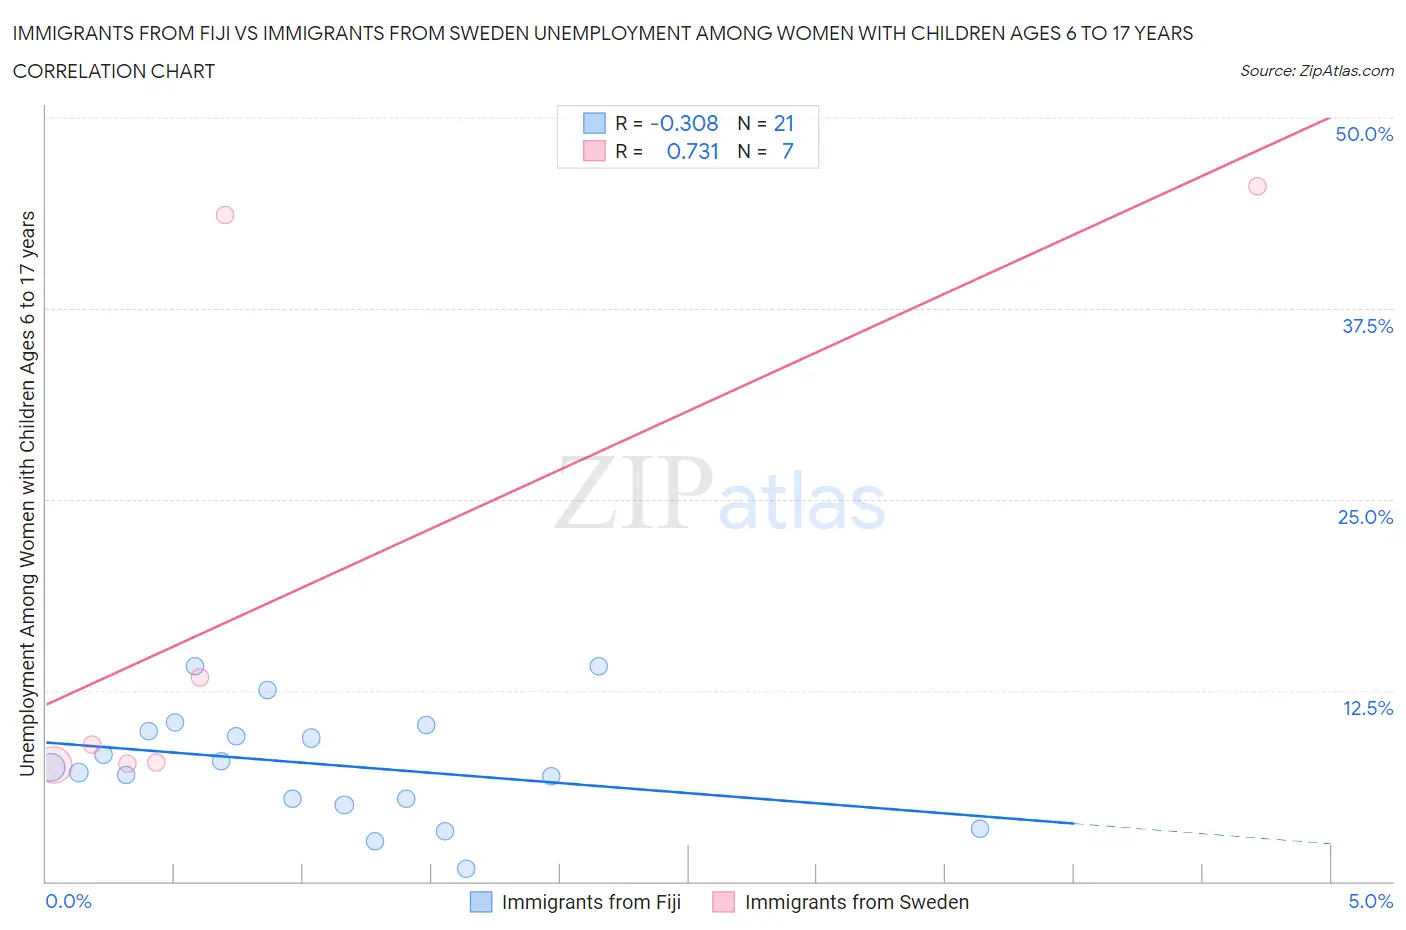
Immigrants from Fiji vs Immigrants from Sweden Unemployment Among Women with Children Ages 6 to 17 years Correlation Chart
The statistical analysis conducted on geographies consisting of 84,843,445 people shows a mild negative correlation between the proportion of Immigrants from Fiji and unemployment rate among women with children between the ages 6 and 17 in the United States with a correlation coefficient (R) of -0.308 and weighted average of 7.3%. Similarly, the statistical analysis conducted on geographies consisting of 133,294,007 people shows a strong positive correlation between the proportion of Immigrants from Sweden and unemployment rate among women with children between the ages 6 and 17 in the United States with a correlation coefficient (R) of 0.731 and weighted average of 8.1%, a difference of 10.7%.
Unemployment Among Women with Children Ages 6 to 17 years Correlation Summary
| Measurement | Immigrants from Fiji | Immigrants from Sweden |
| Minimum | 0.80% | 7.6% |
| Maximum | 14.1% | 45.5% |
| Range | 13.3% | 37.9% |
| Mean | 7.6% | 19.2% |
| Median | 7.5% | 8.9% |
| Interquartile 25% (IQ1) | 5.2% | 7.7% |
| Interquartile 75% (IQ3) | 10.0% | 43.6% |
| Interquartile Range (IQR) | 4.8% | 35.9% |
| Standard Deviation (Sample) | 3.6% | 17.4% |
| Standard Deviation (Population) | 3.5% | 16.1% |
Similar Demographics by Unemployment Among Women with Children Ages 6 to 17 years
Demographics Similar to Immigrants from Fiji by Unemployment Among Women with Children Ages 6 to 17 years
In terms of unemployment among women with children ages 6 to 17 years, the demographic groups most similar to Immigrants from Fiji are Immigrants from Taiwan (7.3%, a difference of 0.70%), Assyrian/Chaldean/Syriac (7.2%, a difference of 0.97%), Bangladeshi (7.4%, a difference of 1.0%), Immigrants from Hong Kong (7.2%, a difference of 1.3%), and Indonesian (7.4%, a difference of 1.7%).
| Demographics | Rating | Rank | Unemployment Among Women with Children Ages 6 to 17 years |
| Tongans | 100.0 /100 | #3 | Exceptional 6.7% |
| Ute | 100.0 /100 | #4 | Exceptional 7.0% |
| Okinawans | 100.0 /100 | #5 | Exceptional 7.0% |
| Tlingit-Haida | 100.0 /100 | #6 | Exceptional 7.1% |
| Soviet Union | 100.0 /100 | #7 | Exceptional 7.1% |
| Immigrants | Hong Kong | 100.0 /100 | #8 | Exceptional 7.2% |
| Assyrians/Chaldeans/Syriacs | 100.0 /100 | #9 | Exceptional 7.2% |
| Immigrants | Fiji | 100.0 /100 | #10 | Exceptional 7.3% |
| Immigrants | Taiwan | 100.0 /100 | #11 | Exceptional 7.3% |
| Bangladeshis | 100.0 /100 | #12 | Exceptional 7.4% |
| Indonesians | 100.0 /100 | #13 | Exceptional 7.4% |
| Sudanese | 100.0 /100 | #14 | Exceptional 7.4% |
| Puget Sound Salish | 100.0 /100 | #15 | Exceptional 7.5% |
| Immigrants | Burma/Myanmar | 100.0 /100 | #16 | Exceptional 7.5% |
| Cambodians | 100.0 /100 | #17 | Exceptional 7.5% |
Demographics Similar to Immigrants from Sweden by Unemployment Among Women with Children Ages 6 to 17 years
In terms of unemployment among women with children ages 6 to 17 years, the demographic groups most similar to Immigrants from Sweden are Bhutanese (8.1%, a difference of 0.040%), Immigrants from Bulgaria (8.1%, a difference of 0.050%), Icelander (8.1%, a difference of 0.060%), Immigrants from Switzerland (8.1%, a difference of 0.10%), and Immigrants from Somalia (8.0%, a difference of 0.18%).
| Demographics | Rating | Rank | Unemployment Among Women with Children Ages 6 to 17 years |
| Asians | 100.0 /100 | #37 | Exceptional 8.0% |
| Alsatians | 100.0 /100 | #38 | Exceptional 8.0% |
| Somalis | 100.0 /100 | #39 | Exceptional 8.0% |
| Immigrants | Zimbabwe | 100.0 /100 | #40 | Exceptional 8.0% |
| Iranians | 100.0 /100 | #41 | Exceptional 8.0% |
| Immigrants | Somalia | 100.0 /100 | #42 | Exceptional 8.0% |
| Bhutanese | 100.0 /100 | #43 | Exceptional 8.1% |
| Immigrants | Sweden | 100.0 /100 | #44 | Exceptional 8.1% |
| Immigrants | Bulgaria | 100.0 /100 | #45 | Exceptional 8.1% |
| Icelanders | 100.0 /100 | #46 | Exceptional 8.1% |
| Immigrants | Switzerland | 100.0 /100 | #47 | Exceptional 8.1% |
| Immigrants | Asia | 100.0 /100 | #48 | Exceptional 8.1% |
| Immigrants | Oceania | 100.0 /100 | #49 | Exceptional 8.1% |
| Hawaiians | 100.0 /100 | #50 | Exceptional 8.1% |
| Immigrants | Sudan | 100.0 /100 | #51 | Exceptional 8.1% |