Immigrants from Albania vs Yaqui Unemployment Among Women with Children Ages 6 to 17 years

COMPARE

Immigrants from Albania
Race
Ancestry
AfghanAfricanAlaska NativeAlaskan AthabascanAlbanianAleutAlsatianAmericanApacheArabArapahoArgentineanArmenianAssyrian/Chaldean/SyriacAustralianAustrianBahamianBangladeshiBarbadianBasqueBelgianBelizeanBermudanBhutaneseBlackfeetBolivianBrazilianBritishBritish West IndianBulgarianBurmeseCajunCambodianCanadianCape VerdeanCarpatho RusynCelticCentral AmericanCentral American IndianCherokeeCheyenneChickasawChileanChineseChippewaChoctawColombianColvilleComancheCosta RicanCreeCreekCroatianCrowCubanCypriotCzechCzechoslovakianDanishDelawareDominicanDutchDutch West IndianEastern EuropeanEcuadorianEgyptianEnglishEstonianEthiopianEuropeanFijianFilipinoFinnishFrenchFrench American IndianFrench CanadianGermanGerman RussianGhanaianGreekGuamanian/ChamorroGuatemalanGuyaneseHaitianHmongHonduranHopiHoumaHungarianIcelanderIndian (Asian)IndonesianInupiatIranianIraqiIrishIroquoisIsraeliItalianJamaicanJapaneseJordanianKenyanKiowaKoreanLaotianLatvianLebaneseLiberianLithuanianLumbeeLuxembourgerMacedonianMalaysianMalteseMarshalleseMenomineeMexicanMexican American IndianMongolianMoroccanNative HawaiianNavajoNepaleseNew ZealanderNicaraguanNigerianNorthern EuropeanNorwegianOkinawanOsageOttawaPaiutePakistaniPalestinianPanamanianParaguayanPennsylvania GermanPeruvianPimaPolishPortuguesePotawatomiPuebloPuerto RicanPuget Sound SalishRomanianRussianSalvadoranSamoanScandinavianScotch-IrishScottishSeminoleSenegaleseSerbianShoshoneSierra LeoneanSiouxSlavicSlovakSloveneSomaliSouth AfricanSouth AmericanSouth American IndianSoviet UnionSpaniardSpanishSpanish AmericanSpanish American IndianSri LankanSubsaharan AfricanSudaneseSwedishSwissSyrianTaiwaneseThaiTlingit-HaidaTohono O'OdhamTonganTrinidadian and TobagonianTsimshianTurkishU.S. Virgin IslanderUgandanUkrainianUruguayanUteVenezuelanVietnameseWelshWest IndianYakamaYugoslavianYumanYup'ikZimbabwean
Immigration
NonimmigrantsImmigrantsAfghanistanAfricaAlbaniaArgentinaArmeniaAsiaAustraliaAustriaBahamasBangladeshBarbadosBelarusBelgiumBelizeBoliviaBosnia and HerzegovinaBrazilBulgariaBurma/MyanmarCabo VerdeCambodiaCameroonCanadaCaribbeanCentral AmericaChileChinaColombiaCongoCosta RicaCroatiaCubaCzechoslovakiaDenmarkDominicaDominican RepublicEastern AfricaEastern AsiaEastern EuropeEcuadorEgyptEl SalvadorEnglandEritreaEthiopiaEuropeFijiFranceGermanyGhanaGreeceGrenadaGuatemalaGuyanaHaitiHondurasHong KongHungaryIndiaIndonesiaIranIraqIrelandIsraelItalyJamaicaJapanJordanKazakhstanKenyaKoreaKuwaitLaosLatin AmericaLatviaLebanonLiberiaLithuaniaMalaysiaMexicoMicronesiaMiddle AfricaMoldovaMoroccoNepalNetherlandsNicaraguaNigeriaNorth AmericaNorth MacedoniaNorthern AfricaNorthern EuropeNorwayOceaniaPakistanPanamaPeruPhilippinesPolandPortugalRomaniaRussiaSaudi ArabiaScotlandSenegalSerbiaSierra LeoneSingaporeSomaliaSouth AfricaSouth AmericaSouth Central AsiaSouth Eastern AsiaSouthern EuropeSpainSri LankaSt. Vincent and the GrenadinesSudanSwedenSwitzerlandSyriaTaiwanThailandTrinidad and TobagoTurkeyUgandaUkraineUruguayUzbekistanVenezuelaVietnamWest IndiesWestern AfricaWestern AsiaWestern EuropeYemenZaireZimbabweAzores
Yaqui
Race
Ancestry
AfghanAfricanAlaska NativeAlaskan AthabascanAlbanianAleutAlsatianAmericanApacheArabArapahoArgentineanArmenianAssyrian/Chaldean/SyriacAustralianAustrianBahamianBangladeshiBarbadianBasqueBelgianBelizeanBermudanBhutaneseBlackfeetBolivianBrazilianBritishBritish West IndianBulgarianBurmeseCajunCambodianCanadianCape VerdeanCarpatho RusynCelticCentral AmericanCentral American IndianCherokeeCheyenneChickasawChileanChineseChippewaChoctawColombianColvilleComancheCosta RicanCreeCreekCroatianCrowCubanCypriotCzechCzechoslovakianDanishDelawareDominicanDutchDutch West IndianEastern EuropeanEcuadorianEgyptianEnglishEstonianEthiopianEuropeanFijianFilipinoFinnishFrenchFrench American IndianFrench CanadianGermanGerman RussianGhanaianGreekGuamanian/ChamorroGuatemalanGuyaneseHaitianHmongHonduranHopiHoumaHungarianIcelanderIndian (Asian)IndonesianInupiatIranianIraqiIrishIroquoisIsraeliItalianJamaicanJapaneseJordanianKenyanKiowaKoreanLaotianLatvianLebaneseLiberianLithuanianLumbeeLuxembourgerMacedonianMalaysianMalteseMarshalleseMenomineeMexicanMexican American IndianMongolianMoroccanNative HawaiianNavajoNepaleseNew ZealanderNicaraguanNigerianNorthern EuropeanNorwegianOkinawanOsageOttawaPaiutePakistaniPalestinianPanamanianParaguayanPennsylvania GermanPeruvianPimaPolishPortuguesePotawatomiPuebloPuerto RicanPuget Sound SalishRomanianRussianSalvadoranSamoanScandinavianScotch-IrishScottishSeminoleSenegaleseSerbianShoshoneSierra LeoneanSiouxSlavicSlovakSloveneSomaliSouth AfricanSouth AmericanSouth American IndianSoviet UnionSpaniardSpanishSpanish AmericanSpanish American IndianSri LankanSubsaharan AfricanSudaneseSwedishSwissSyrianTaiwaneseThaiTlingit-HaidaTohono O'OdhamTonganTrinidadian and TobagonianTsimshianTurkishU.S. Virgin IslanderUgandanUkrainianUruguayanUteVenezuelanVietnameseWelshWest IndianYakamaYaquiYugoslavianYumanYup'ikZimbabwean
Immigration
NonimmigrantsImmigrantsAfghanistanAfricaArgentinaArmeniaAsiaAustraliaAustriaBahamasBangladeshBarbadosBelarusBelgiumBelizeBoliviaBosnia and HerzegovinaBrazilBulgariaBurma/MyanmarCabo VerdeCambodiaCameroonCanadaCaribbeanCentral AmericaChileChinaColombiaCongoCosta RicaCroatiaCubaCzechoslovakiaDenmarkDominicaDominican RepublicEastern AfricaEastern AsiaEastern EuropeEcuadorEgyptEl SalvadorEnglandEritreaEthiopiaEuropeFijiFranceGermanyGhanaGreeceGrenadaGuatemalaGuyanaHaitiHondurasHong KongHungaryIndiaIndonesiaIranIraqIrelandIsraelItalyJamaicaJapanJordanKazakhstanKenyaKoreaKuwaitLaosLatin AmericaLatviaLebanonLiberiaLithuaniaMalaysiaMexicoMicronesiaMiddle AfricaMoldovaMoroccoNepalNetherlandsNicaraguaNigeriaNorth AmericaNorth MacedoniaNorthern AfricaNorthern EuropeNorwayOceaniaPakistanPanamaPeruPhilippinesPolandPortugalRomaniaRussiaSaudi ArabiaScotlandSenegalSerbiaSierra LeoneSingaporeSomaliaSouth AfricaSouth AmericaSouth Central AsiaSouth Eastern AsiaSouthern EuropeSpainSri LankaSt. Vincent and the GrenadinesSudanSwedenSwitzerlandSyriaTaiwanThailandTrinidad and TobagoTurkeyUgandaUkraineUruguayUzbekistanVenezuelaVietnamWest IndiesWestern AfricaWestern AsiaWestern EuropeYemenZaireZimbabweAzores
Unemployment Among Women with Children Ages 6 to 17 years
Income
Poverty
Unemployment
Labor Participation
Family Structure
Vehicle Availability
Education Level
Disability

Unemployment Among Women with Children Ages 6 to 17 years Comparison

Immigrants from Albania

Yaqui

Exceptional
Exceptional
8.3%
UNEMPLOYMENT AMONG WOMEN WITH CHILDREN AGES 6 TO 17 YEARS
99.9/ 100
METRIC RATING
65th/ 347
METRIC RANK
8.7%
UNEMPLOYMENT AMONG WOMEN WITH CHILDREN AGES 6 TO 17 YEARS
92.2/ 100
METRIC RATING
132nd/ 347
METRIC RANK

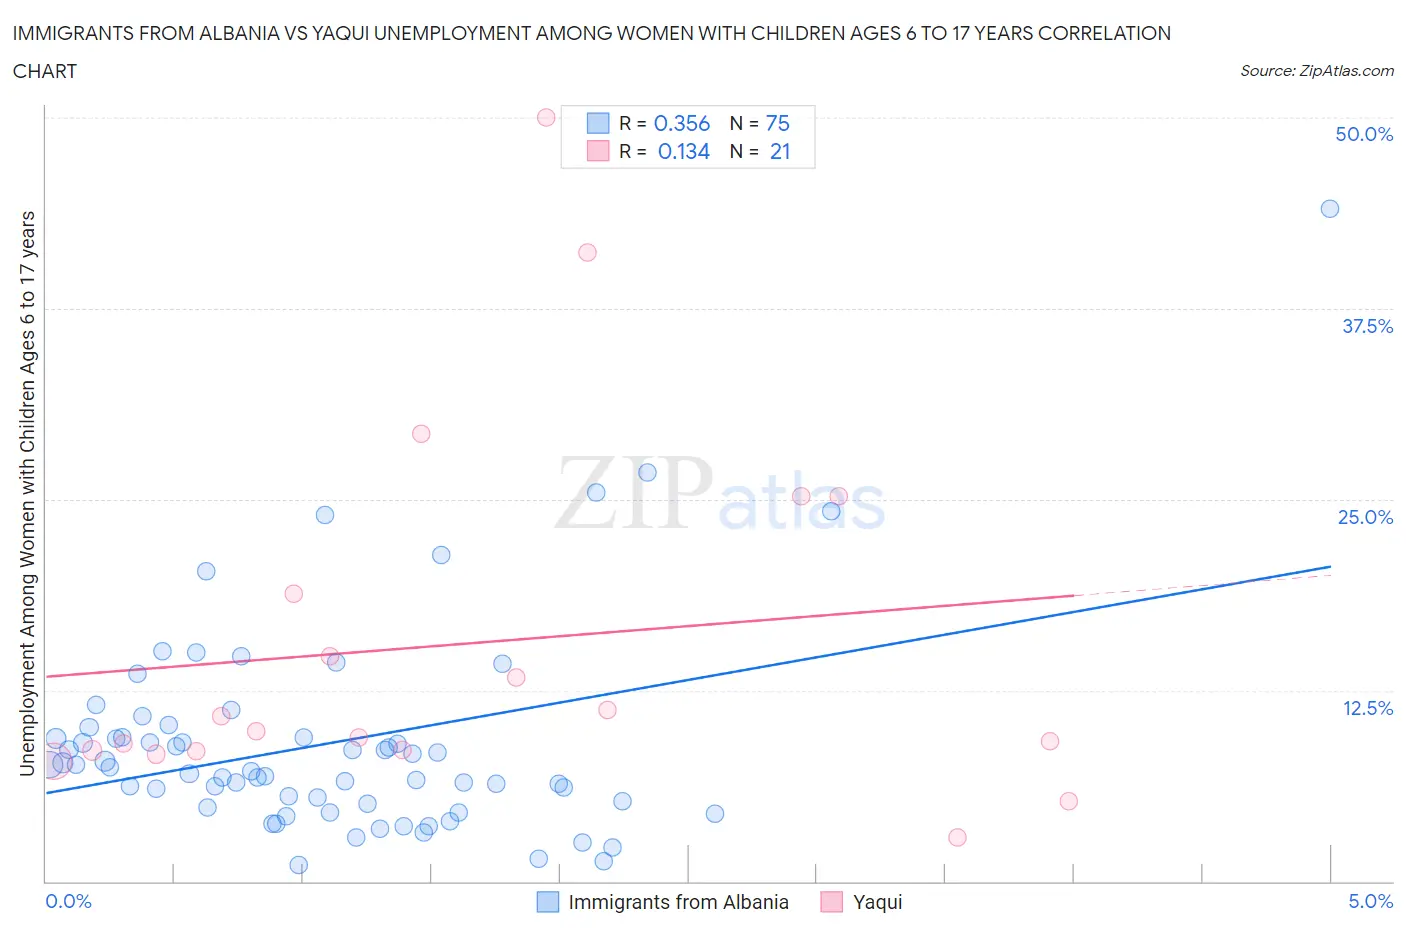
Immigrants from Albania vs Yaqui Unemployment Among Women with Children Ages 6 to 17 years Correlation Chart

The statistical analysis conducted on geographies consisting of 97,610,353 people shows a mild positive correlation between the proportion of Immigrants from Albania and unemployment rate among women with children between the ages 6 and 17 in the United States with a correlation coefficient (R) of 0.356 and weighted average of 8.3%. Similarly, the statistical analysis conducted on geographies consisting of 95,121,175 people shows a poor positive correlation between the proportion of Yaqui and unemployment rate among women with children between the ages 6 and 17 in the United States with a correlation coefficient (R) of 0.134 and weighted average of 8.7%, a difference of 5.3%.
Immigrants from Albania vs Yaqui Unemployment Among Women with Children Ages 6 to 17 years

Unemployment Among Women with Children Ages 6 to 17 years Correlation Summary

MeasurementImmigrants from AlbaniaYaqui
Minimum1.1%2.9%
Maximum44.0%50.0%
Range42.9%47.1%
Mean9.0%15.6%
Median7.4%9.8%
Interquartile 25% (IQ1)5.1%8.5%
Interquartile 75% (IQ3)9.4%22.0%
Interquartile Range (IQR)4.3%13.5%
Standard Deviation (Sample)6.9%12.2%
Standard Deviation (Population)6.8%11.9%

Similar Demographics by Unemployment Among Women with Children Ages 6 to 17 years

Demographics Similar to Immigrants from Albania by Unemployment Among Women with Children Ages 6 to 17 years

In terms of unemployment among women with children ages 6 to 17 years, the demographic groups most similar to Immigrants from Albania are Immigrants from Kuwait (8.3%, a difference of 0.090%), Luxembourger (8.3%, a difference of 0.13%), Armenian (8.3%, a difference of 0.23%), Marshallese (8.3%, a difference of 0.32%), and Immigrants from Thailand (8.3%, a difference of 0.34%).
DemographicsRating | RankUnemployment Among Women with Children Ages 6 to 17 years
Immigrants | Malaysia
100.0
/100
|
#58
Exceptional
8.2%
Immigrants | Philippines
100.0
/100
|
#59
Exceptional
8.2%
Basques
100.0
/100
|
#60
Exceptional
8.2%
Koreans
100.0
/100
|
#61
Exceptional
8.2%
Spanish American Indians
100.0
/100
|
#62
Exceptional
8.2%
Immigrants | South Eastern Asia
99.9
/100
|
#63
Exceptional
8.2%
Immigrants | Kuwait
99.9
/100
|
#64
Exceptional
8.3%
Immigrants | Albania
99.9
/100
|
#65
Exceptional
8.3%
Luxembourgers
99.9
/100
|
#66
Exceptional
8.3%
Armenians
99.9
/100
|
#67
Exceptional
8.3%
Marshallese
99.9
/100
|
#68
Exceptional
8.3%
Immigrants | Thailand
99.9
/100
|
#69
Exceptional
8.3%
Norwegians
99.9
/100
|
#70
Exceptional
8.3%
Immigrants | Australia
99.8
/100
|
#71
Exceptional
8.3%
Immigrants | Nepal
99.8
/100
|
#72
Exceptional
8.3%

Demographics Similar to Yaqui by Unemployment Among Women with Children Ages 6 to 17 years

In terms of unemployment among women with children ages 6 to 17 years, the demographic groups most similar to Yaqui are Slavic (8.7%, a difference of 0.010%), Egyptian (8.7%, a difference of 0.060%), Immigrants from Western Asia (8.7%, a difference of 0.16%), Immigrants from Ireland (8.7%, a difference of 0.17%), and European (8.7%, a difference of 0.23%).
DemographicsRating | RankUnemployment Among Women with Children Ages 6 to 17 years
South Africans
94.6
/100
|
#125
Exceptional
8.7%
Immigrants | Northern Africa
94.4
/100
|
#126
Exceptional
8.7%
Czechs
94.4
/100
|
#127
Exceptional
8.7%
Hmong
94.3
/100
|
#128
Exceptional
8.7%
Barbadians
93.8
/100
|
#129
Exceptional
8.7%
Immigrants | Western Asia
93.1
/100
|
#130
Exceptional
8.7%
Slavs
92.2
/100
|
#131
Exceptional
8.7%
Yaqui
92.2
/100
|
#132
Exceptional
8.7%
Egyptians
91.8
/100
|
#133
Exceptional
8.7%
Immigrants | Ireland
91.0
/100
|
#134
Exceptional
8.7%
Europeans
90.6
/100
|
#135
Exceptional
8.7%
Immigrants | Latvia
90.4
/100
|
#136
Exceptional
8.7%
Immigrants | Argentina
90.0
/100
|
#137
Excellent
8.7%
Immigrants | Ethiopia
89.5
/100
|
#138
Excellent
8.8%
Northern Europeans
89.2
/100
|
#139
Excellent
8.8%