Zip Codes with the Highest Percentage of Population Employed in Transportation & Warehousing in San Antonio, TX
RELATED REPORTS & OPTIONS
Transportation & Warehousing
San Antonio
Compare Zip Codes
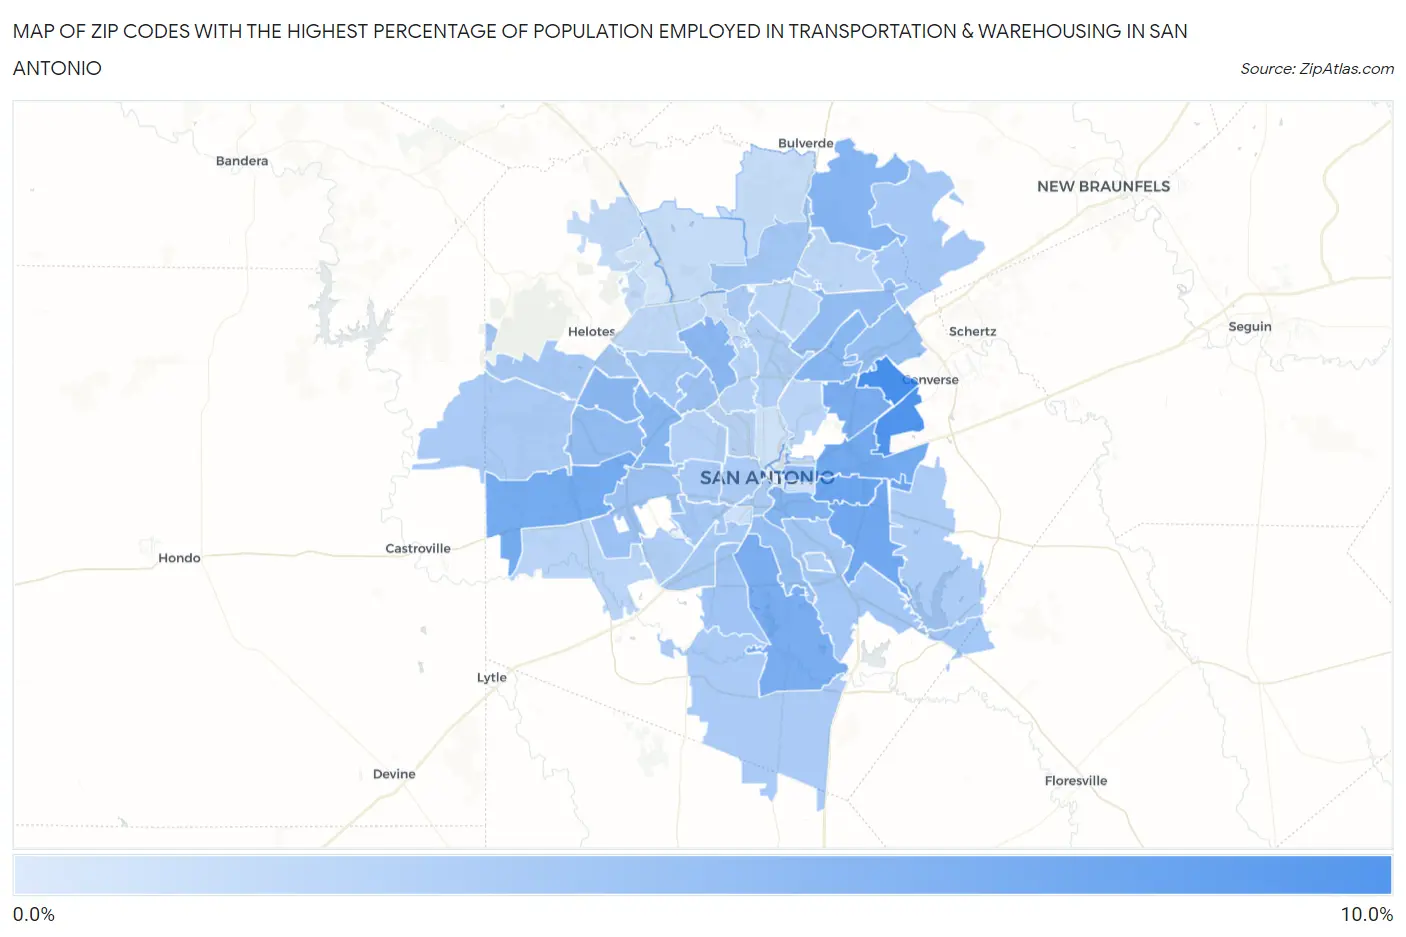
Map of Zip Codes with the Highest Percentage of Population Employed in Transportation & Warehousing in San Antonio
0.0%
10.0%
Zip Codes with the Highest Percentage of Population Employed in Transportation & Warehousing in San Antonio, TX
| Zip Code | % Employed | vs State | vs National | |
| 1. | 78239 | 9.6% | 5.5%(+4.14)#228 | 4.9%(+4.69)#3,125 |
| 2. | 78244 | 9.1% | 5.5%(+3.56)#263 | 4.9%(+4.12)#3,632 |
| 3. | 78220 | 7.5% | 5.5%(+2.01)#397 | 4.9%(+2.56)#5,622 |
| 4. | 78222 | 7.2% | 5.5%(+1.73)#432 | 4.9%(+2.29)#6,134 |
| 5. | 78219 | 7.1% | 5.5%(+1.58)#453 | 4.9%(+2.13)#6,384 |
| 6. | 78245 | 6.9% | 5.5%(+1.39)#482 | 4.9%(+1.95)#6,770 |
| 7. | 78221 | 6.7% | 5.5%(+1.23)#506 | 4.9%(+1.78)#7,096 |
| 8. | 78218 | 6.7% | 5.5%(+1.22)#510 | 4.9%(+1.77)#7,116 |
| 9. | 78210 | 6.2% | 5.5%(+0.677)#585 | 4.9%(+1.23)#8,341 |
| 10. | 78261 | 6.0% | 5.5%(+0.467)#619 | 4.9%(+1.02)#8,870 |
| 11. | 78238 | 5.8% | 5.5%(+0.313)#648 | 4.9%(+0.868)#9,296 |
| 12. | 78217 | 5.8% | 5.5%(+0.305)#650 | 4.9%(+0.860)#9,318 |
| 13. | 78250 | 5.7% | 5.5%(+0.199)#670 | 4.9%(+0.754)#9,652 |
| 14. | 78230 | 5.7% | 5.5%(+0.174)#678 | 4.9%(+0.729)#9,730 |
| 15. | 78202 | 5.3% | 5.5%(-0.173)#757 | 4.9%(+0.383)#10,826 |
| 16. | 78251 | 5.2% | 5.5%(-0.278)#775 | 4.9%(+0.277)#11,164 |
| 17. | 78247 | 5.2% | 5.5%(-0.347)#788 | 4.9%(+0.209)#11,413 |
| 18. | 78233 | 5.1% | 5.5%(-0.371)#799 | 4.9%(+0.185)#11,505 |
| 19. | 78214 | 5.1% | 5.5%(-0.414)#806 | 4.9%(+0.141)#11,657 |
| 20. | 78229 | 4.7% | 5.5%(-0.822)#887 | 4.9%(-0.266)#13,096 |
| 21. | 78227 | 4.6% | 5.5%(-0.859)#898 | 4.9%(-0.304)#13,245 |
| 22. | 78224 | 4.4% | 5.5%(-1.07)#944 | 4.9%(-0.515)#14,027 |
| 23. | 78223 | 4.3% | 5.5%(-1.16)#963 | 4.9%(-0.600)#14,409 |
| 24. | 78258 | 4.3% | 5.5%(-1.17)#969 | 4.9%(-0.614)#14,465 |
| 25. | 78240 | 4.3% | 5.5%(-1.20)#973 | 4.9%(-0.647)#14,602 |
| 26. | 78226 | 4.2% | 5.5%(-1.27)#991 | 4.9%(-0.718)#14,902 |
| 27. | 78254 | 4.2% | 5.5%(-1.33)#1,004 | 4.9%(-0.779)#15,158 |
| 28. | 78266 | 4.2% | 5.5%(-1.35)#1,013 | 4.9%(-0.790)#15,234 |
| 29. | 78211 | 4.1% | 5.5%(-1.43)#1,034 | 4.9%(-0.878)#15,611 |
| 30. | 78204 | 4.0% | 5.5%(-1.51)#1,056 | 4.9%(-0.956)#15,954 |
| 31. | 78264 | 3.9% | 5.5%(-1.57)#1,068 | 4.9%(-1.02)#16,235 |
| 32. | 78253 | 3.9% | 5.5%(-1.61)#1,078 | 4.9%(-1.05)#16,386 |
| 33. | 78248 | 3.9% | 5.5%(-1.62)#1,083 | 4.9%(-1.06)#16,434 |
| 34. | 78237 | 3.9% | 5.5%(-1.63)#1,088 | 4.9%(-1.08)#16,502 |
| 35. | 78263 | 3.8% | 5.5%(-1.71)#1,107 | 4.9%(-1.15)#16,812 |
| 36. | 78207 | 3.8% | 5.5%(-1.75)#1,122 | 4.9%(-1.20)#17,017 |
| 37. | 78216 | 3.6% | 5.5%(-1.94)#1,162 | 4.9%(-1.38)#17,814 |
| 38. | 78242 | 3.5% | 5.5%(-2.01)#1,181 | 4.9%(-1.45)#18,116 |
| 39. | 78235 | 3.4% | 5.5%(-2.10)#1,201 | 4.9%(-1.54)#18,480 |
| 40. | 78228 | 3.4% | 5.5%(-2.11)#1,209 | 4.9%(-1.55)#18,528 |
| 41. | 78213 | 3.2% | 5.5%(-2.26)#1,253 | 4.9%(-1.71)#19,193 |
| 42. | 78201 | 3.1% | 5.5%(-2.37)#1,283 | 4.9%(-1.82)#19,662 |
| 43. | 78252 | 3.0% | 5.5%(-2.48)#1,312 | 4.9%(-1.93)#20,162 |
| 44. | 78209 | 3.0% | 5.5%(-2.49)#1,314 | 4.9%(-1.93)#20,176 |
| 45. | 78232 | 3.0% | 5.5%(-2.51)#1,320 | 4.9%(-1.95)#20,253 |
| 46. | 78259 | 2.9% | 5.5%(-2.61)#1,352 | 4.9%(-2.06)#20,739 |
| 47. | 78249 | 2.7% | 5.5%(-2.77)#1,387 | 4.9%(-2.21)#21,410 |
| 48. | 78255 | 2.5% | 5.5%(-3.02)#1,434 | 4.9%(-2.47)#22,498 |
| 49. | 78257 | 2.4% | 5.5%(-3.10)#1,446 | 4.9%(-2.55)#22,832 |
| 50. | 78260 | 2.3% | 5.5%(-3.18)#1,458 | 4.9%(-2.62)#23,109 |
| 51. | 78208 | 2.2% | 5.5%(-3.32)#1,481 | 4.9%(-2.76)#23,612 |
| 52. | 78231 | 1.9% | 5.5%(-3.57)#1,510 | 4.9%(-3.02)#24,493 |
| 53. | 78225 | 1.9% | 5.5%(-3.57)#1,511 | 4.9%(-3.02)#24,500 |
| 54. | 78212 | 1.9% | 5.5%(-3.65)#1,521 | 4.9%(-3.09)#24,767 |
| 55. | 78203 | 1.8% | 5.5%(-3.71)#1,526 | 4.9%(-3.15)#24,957 |
| 56. | 78256 | 1.5% | 5.5%(-4.05)#1,568 | 4.9%(-3.49)#25,966 |
| 57. | 78215 | 1.1% | 5.5%(-4.41)#1,600 | 4.9%(-3.86)#26,823 |
1
Common Questions
What are the Top 10 Zip Codes with the Highest Percentage of Population Employed in Transportation & Warehousing in San Antonio, TX?
Top 10 Zip Codes with the Highest Percentage of Population Employed in Transportation & Warehousing in San Antonio, TX are:
What zip code has the Highest Percentage of Population Employed in Transportation & Warehousing in San Antonio, TX?
78239 has the Highest Percentage of Population Employed in Transportation & Warehousing in San Antonio, TX with 9.6%.
What is the Percentage of Population Employed in Transportation & Warehousing in San Antonio, TX?
Percentage of Population Employed in Transportation & Warehousing in San Antonio is 4.5%.
What is the Percentage of Population Employed in Transportation & Warehousing in Texas?
Percentage of Population Employed in Transportation & Warehousing in Texas is 5.5%.
What is the Percentage of Population Employed in Transportation & Warehousing in the United States?
Percentage of Population Employed in Transportation & Warehousing in the United States is 4.9%.