Zip Codes with the Highest Percentage of Population Employed in Arts, Entertainment & Recreation in San Antonio, TX
RELATED REPORTS & OPTIONS
Arts, Entertainment & Recreation
San Antonio
Compare Zip Codes
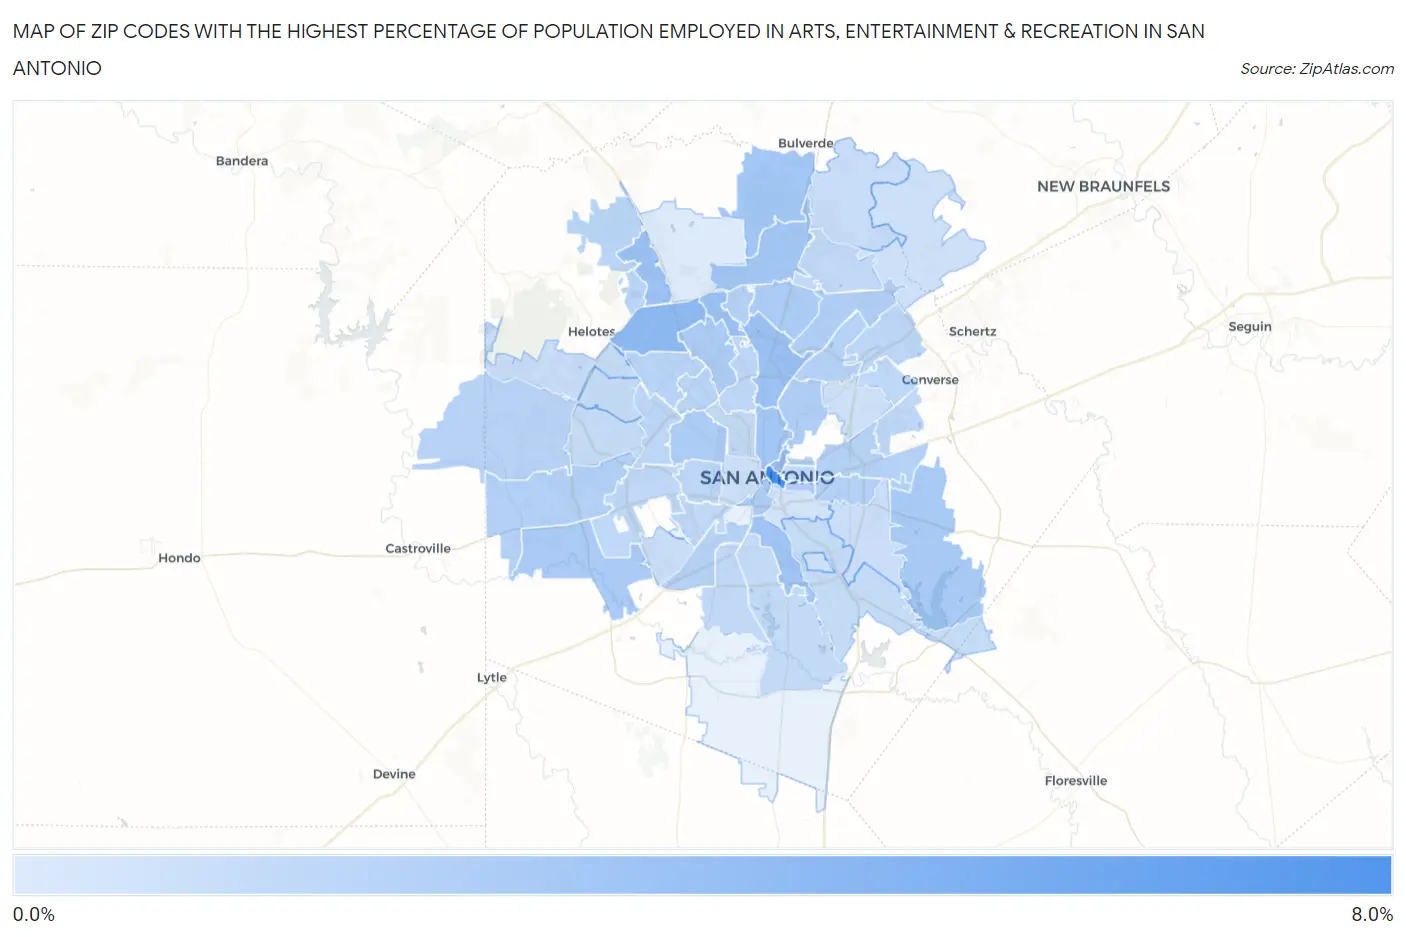
Map of Zip Codes with the Highest Percentage of Population Employed in Arts, Entertainment & Recreation in San Antonio
0.0%
8.0%
Zip Codes with the Highest Percentage of Population Employed in Arts, Entertainment & Recreation in San Antonio, TX
| Zip Code | % Employed | vs State | vs National | |
| 1. | 78205 | 6.7% | 1.5%(+5.21)#29 | 2.1%(+4.59)#1,423 |
| 2. | 78249 | 3.5% | 1.5%(+2.05)#96 | 2.1%(+1.43)#4,103 |
| 3. | 78215 | 3.2% | 1.5%(+1.76)#115 | 2.1%(+1.14)#4,729 |
| 4. | 78256 | 3.0% | 1.5%(+1.58)#136 | 2.1%(+0.963)#5,232 |
| 5. | 78216 | 2.9% | 1.5%(+1.43)#157 | 2.1%(+0.815)#5,652 |
| 6. | 78231 | 2.9% | 1.5%(+1.43)#158 | 2.1%(+0.814)#5,656 |
| 7. | 78214 | 2.7% | 1.5%(+1.22)#189 | 2.1%(+0.598)#6,436 |
| 8. | 78260 | 2.6% | 1.5%(+1.17)#197 | 2.1%(+0.554)#6,623 |
| 9. | 78258 | 2.6% | 1.5%(+1.16)#202 | 2.1%(+0.537)#6,673 |
| 10. | 78212 | 2.6% | 1.5%(+1.15)#204 | 2.1%(+0.532)#6,697 |
| 11. | 78263 | 2.4% | 1.5%(+0.929)#247 | 2.1%(+0.309)#7,676 |
| 12. | 78252 | 2.3% | 1.5%(+0.874)#259 | 2.1%(+0.254)#7,947 |
| 13. | 78232 | 2.2% | 1.5%(+0.739)#288 | 2.1%(+0.119)#8,636 |
| 14. | 78204 | 2.2% | 1.5%(+0.730)#294 | 2.1%(+0.110)#8,685 |
| 15. | 78228 | 2.2% | 1.5%(+0.725)#296 | 2.1%(+0.105)#8,717 |
| 16. | 78230 | 2.2% | 1.5%(+0.691)#310 | 2.1%(+0.071)#8,902 |
| 17. | 78209 | 2.1% | 1.5%(+0.651)#323 | 2.1%(+0.031)#9,139 |
| 18. | 78247 | 2.0% | 1.5%(+0.514)#356 | 2.1%(-0.106)#9,912 |
| 19. | 78203 | 2.0% | 1.5%(+0.508)#358 | 2.1%(-0.112)#9,952 |
| 20. | 78220 | 1.9% | 1.5%(+0.475)#368 | 2.1%(-0.145)#10,149 |
| 21. | 78208 | 1.9% | 1.5%(+0.466)#372 | 2.1%(-0.155)#10,206 |
| 22. | 78245 | 1.9% | 1.5%(+0.454)#380 | 2.1%(-0.166)#10,286 |
| 23. | 78219 | 1.8% | 1.5%(+0.376)#410 | 2.1%(-0.244)#10,764 |
| 24. | 78217 | 1.8% | 1.5%(+0.319)#435 | 2.1%(-0.301)#11,150 |
| 25. | 78248 | 1.8% | 1.5%(+0.318)#436 | 2.1%(-0.302)#11,155 |
| 26. | 78211 | 1.8% | 1.5%(+0.296)#444 | 2.1%(-0.324)#11,307 |
| 27. | 78253 | 1.7% | 1.5%(+0.284)#447 | 2.1%(-0.336)#11,401 |
| 28. | 78240 | 1.6% | 1.5%(+0.164)#490 | 2.1%(-0.456)#12,234 |
| 29. | 78255 | 1.6% | 1.5%(+0.151)#501 | 2.1%(-0.469)#12,352 |
| 30. | 78229 | 1.6% | 1.5%(+0.129)#508 | 2.1%(-0.491)#12,529 |
| 31. | 78238 | 1.5% | 1.5%(+0.044)#552 | 2.1%(-0.576)#13,197 |
| 32. | 78233 | 1.5% | 1.5%(+0.021)#559 | 2.1%(-0.599)#13,345 |
| 33. | 78213 | 1.5% | 1.5%(+0.009)#566 | 2.1%(-0.611)#13,434 |
| 34. | 78237 | 1.5% | 1.5%(-0.001)#577 | 2.1%(-0.621)#13,511 |
| 35. | 78227 | 1.5% | 1.5%(-0.011)#582 | 2.1%(-0.631)#13,591 |
| 36. | 78202 | 1.4% | 1.5%(-0.026)#592 | 2.1%(-0.646)#13,709 |
| 37. | 78239 | 1.4% | 1.5%(-0.042)#599 | 2.1%(-0.662)#13,813 |
| 38. | 78244 | 1.4% | 1.5%(-0.052)#604 | 2.1%(-0.672)#13,903 |
| 39. | 78226 | 1.3% | 1.5%(-0.159)#664 | 2.1%(-0.779)#14,695 |
| 40. | 78224 | 1.3% | 1.5%(-0.165)#666 | 2.1%(-0.785)#14,734 |
| 41. | 78259 | 1.3% | 1.5%(-0.184)#680 | 2.1%(-0.804)#14,877 |
| 42. | 78221 | 1.2% | 1.5%(-0.233)#702 | 2.1%(-0.853)#15,262 |
| 43. | 78201 | 1.2% | 1.5%(-0.252)#710 | 2.1%(-0.872)#15,392 |
| 44. | 78251 | 1.1% | 1.5%(-0.318)#747 | 2.1%(-0.938)#15,910 |
| 45. | 78250 | 1.1% | 1.5%(-0.344)#761 | 2.1%(-0.964)#16,103 |
| 46. | 78223 | 1.1% | 1.5%(-0.357)#770 | 2.1%(-0.977)#16,193 |
| 47. | 78254 | 1.1% | 1.5%(-0.400)#793 | 2.1%(-1.02)#16,523 |
| 48. | 78261 | 0.99% | 1.5%(-0.471)#834 | 2.1%(-1.09)#17,034 |
| 49. | 78222 | 0.92% | 1.5%(-0.539)#863 | 2.1%(-1.16)#17,525 |
| 50. | 78242 | 0.91% | 1.5%(-0.552)#867 | 2.1%(-1.17)#17,611 |
| 51. | 78207 | 0.80% | 1.5%(-0.661)#909 | 2.1%(-1.28)#18,392 |
| 52. | 78235 | 0.76% | 1.5%(-0.706)#932 | 2.1%(-1.33)#18,709 |
| 53. | 78266 | 0.68% | 1.5%(-0.780)#974 | 2.1%(-1.40)#19,274 |
| 54. | 78218 | 0.67% | 1.5%(-0.788)#982 | 2.1%(-1.41)#19,333 |
| 55. | 78210 | 0.66% | 1.5%(-0.799)#986 | 2.1%(-1.42)#19,400 |
| 56. | 78257 | 0.13% | 1.5%(-1.33)#1,237 | 2.1%(-1.95)#22,463 |
1
Common Questions
What are the Top 10 Zip Codes with the Highest Percentage of Population Employed in Arts, Entertainment & Recreation in San Antonio, TX?
Top 10 Zip Codes with the Highest Percentage of Population Employed in Arts, Entertainment & Recreation in San Antonio, TX are:
What zip code has the Highest Percentage of Population Employed in Arts, Entertainment & Recreation in San Antonio, TX?
78205 has the Highest Percentage of Population Employed in Arts, Entertainment & Recreation in San Antonio, TX with 6.7%.
What is the Percentage of Population Employed in Arts, Entertainment & Recreation in San Antonio, TX?
Percentage of Population Employed in Arts, Entertainment & Recreation in San Antonio is 1.8%.
What is the Percentage of Population Employed in Arts, Entertainment & Recreation in Texas?
Percentage of Population Employed in Arts, Entertainment & Recreation in Texas is 1.5%.
What is the Percentage of Population Employed in Arts, Entertainment & Recreation in the United States?
Percentage of Population Employed in Arts, Entertainment & Recreation in the United States is 2.1%.