Zip Codes with the Highest Percentage of Population Employed in Architecture & Engineering in Clarksville, TN
RELATED REPORTS & OPTIONS
Architecture & Engineering
Clarksville
Compare Zip Codes
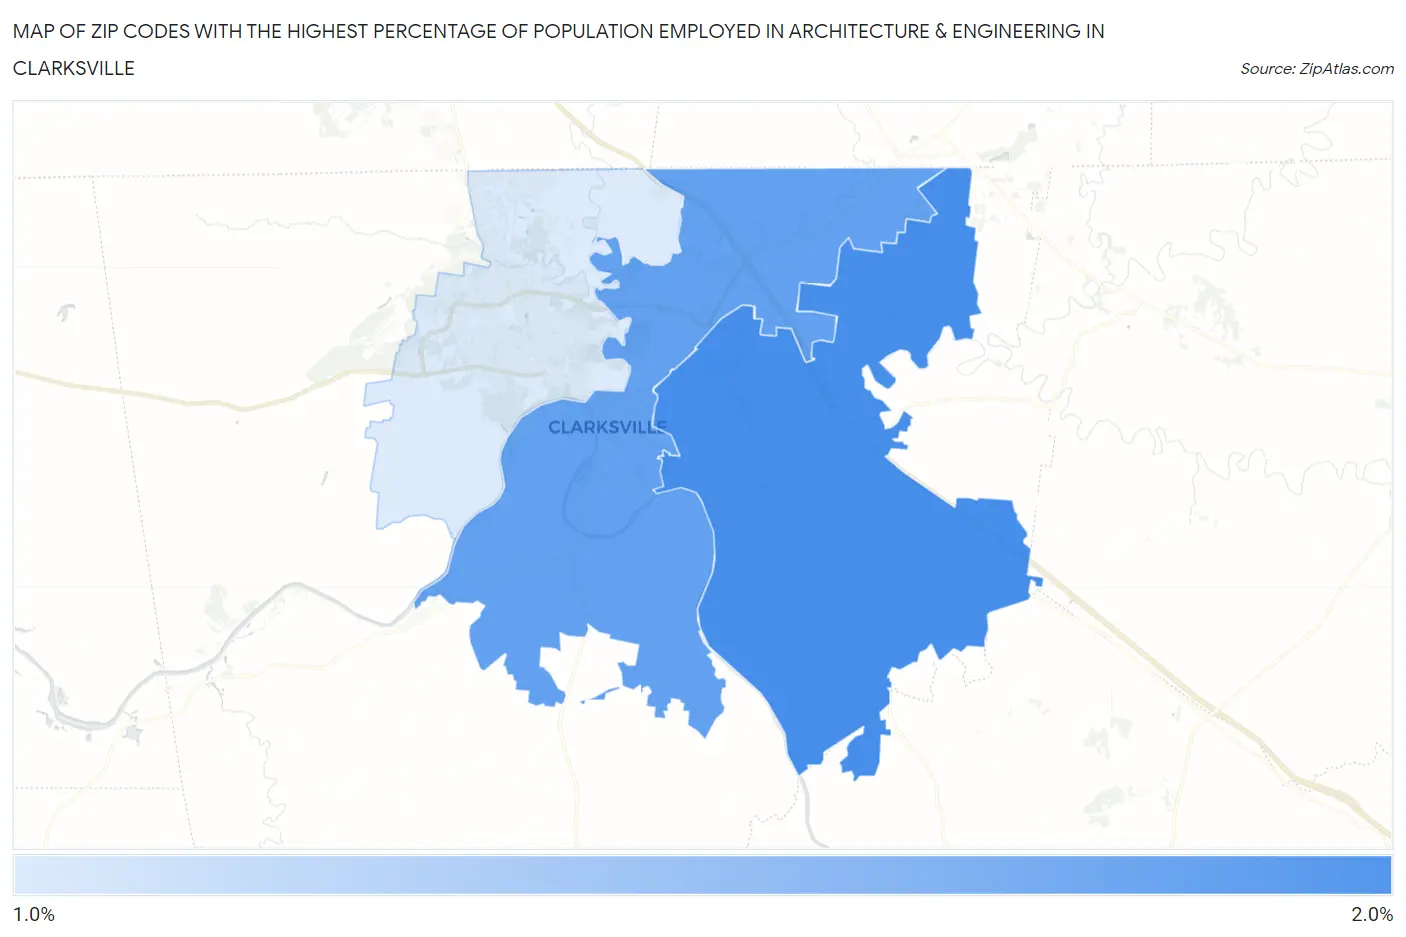
Map of Zip Codes with the Highest Percentage of Population Employed in Architecture & Engineering in Clarksville
0.0%
2.0%
Zip Codes with the Highest Percentage of Population Employed in Architecture & Engineering in Clarksville, TN
| Zip Code | % Employed | vs State | vs National | |
| 1. | 37043 | 1.9% | 1.7%(+0.232)#181 | 2.1%(-0.249)#10,249 |
| 2. | 37040 | 1.8% | 1.7%(+0.147)#198 | 2.1%(-0.334)#10,749 |
| 3. | 37042 | 1.4% | 1.7%(-0.246)#257 | 2.1%(-0.727)#13,421 |
1
Common Questions
What are the Top Zip Codes with the Highest Percentage of Population Employed in Architecture & Engineering in Clarksville, TN?
Top Zip Codes with the Highest Percentage of Population Employed in Architecture & Engineering in Clarksville, TN are:
What zip code has the Highest Percentage of Population Employed in Architecture & Engineering in Clarksville, TN?
37043 has the Highest Percentage of Population Employed in Architecture & Engineering in Clarksville, TN with 1.9%.
What is the Percentage of Population Employed in Architecture & Engineering in Clarksville, TN?
Percentage of Population Employed in Architecture & Engineering in Clarksville is 1.6%.
What is the Percentage of Population Employed in Architecture & Engineering in Tennessee?
Percentage of Population Employed in Architecture & Engineering in Tennessee is 1.7%.
What is the Percentage of Population Employed in Architecture & Engineering in the United States?
Percentage of Population Employed in Architecture & Engineering in the United States is 2.1%.