Zip Codes with the Highest Percentage of Population Employed in Architecture & Engineering in Morristown, TN
RELATED REPORTS & OPTIONS
Architecture & Engineering
Morristown
Compare Zip Codes
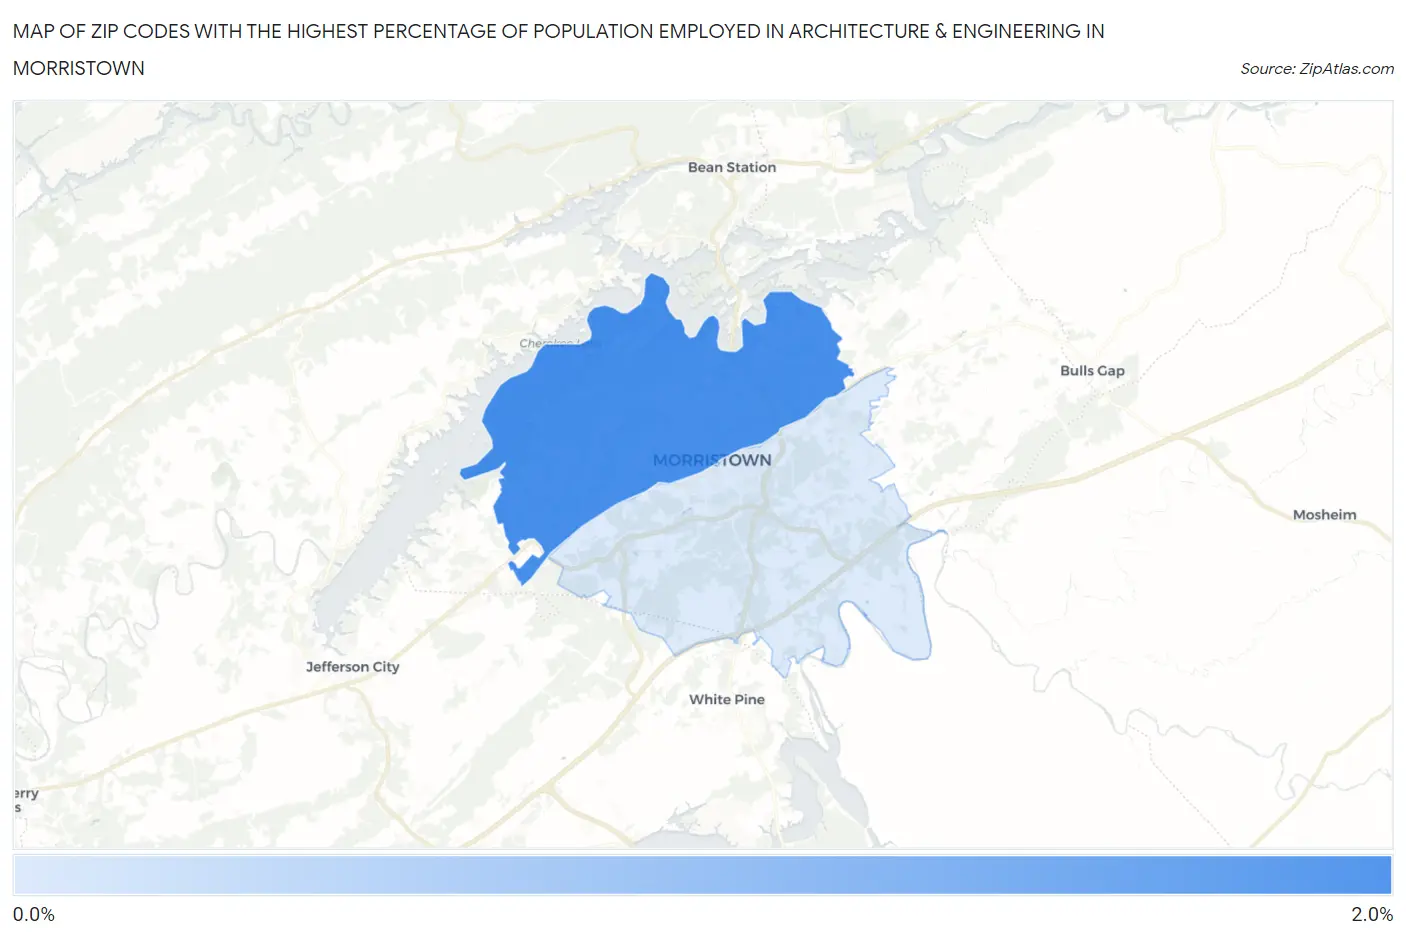
Map of Zip Codes with the Highest Percentage of Population Employed in Architecture & Engineering in Morristown
0.0%
2.0%
Zip Codes with the Highest Percentage of Population Employed in Architecture & Engineering in Morristown, TN
| Zip Code | % Employed | vs State | vs National | |
| 1. | 37814 | 1.7% | 1.7%(+0.061)#213 | 2.1%(-0.420)#11,297 |
| 2. | 37813 | 0.77% | 1.7%(-0.901)#373 | 2.1%(-1.38)#18,383 |
1
Common Questions
What are the Top Zip Codes with the Highest Percentage of Population Employed in Architecture & Engineering in Morristown, TN?
Top Zip Codes with the Highest Percentage of Population Employed in Architecture & Engineering in Morristown, TN are:
What zip code has the Highest Percentage of Population Employed in Architecture & Engineering in Morristown, TN?
37814 has the Highest Percentage of Population Employed in Architecture & Engineering in Morristown, TN with 1.7%.
What is the Percentage of Population Employed in Architecture & Engineering in Morristown, TN?
Percentage of Population Employed in Architecture & Engineering in Morristown is 1.1%.
What is the Percentage of Population Employed in Architecture & Engineering in Tennessee?
Percentage of Population Employed in Architecture & Engineering in Tennessee is 1.7%.
What is the Percentage of Population Employed in Architecture & Engineering in the United States?
Percentage of Population Employed in Architecture & Engineering in the United States is 2.1%.