Zip Codes with the Highest Percentage of Population Employed in Architecture & Engineering in Kingsport, TN
RELATED REPORTS & OPTIONS
Architecture & Engineering
Kingsport
Compare Zip Codes
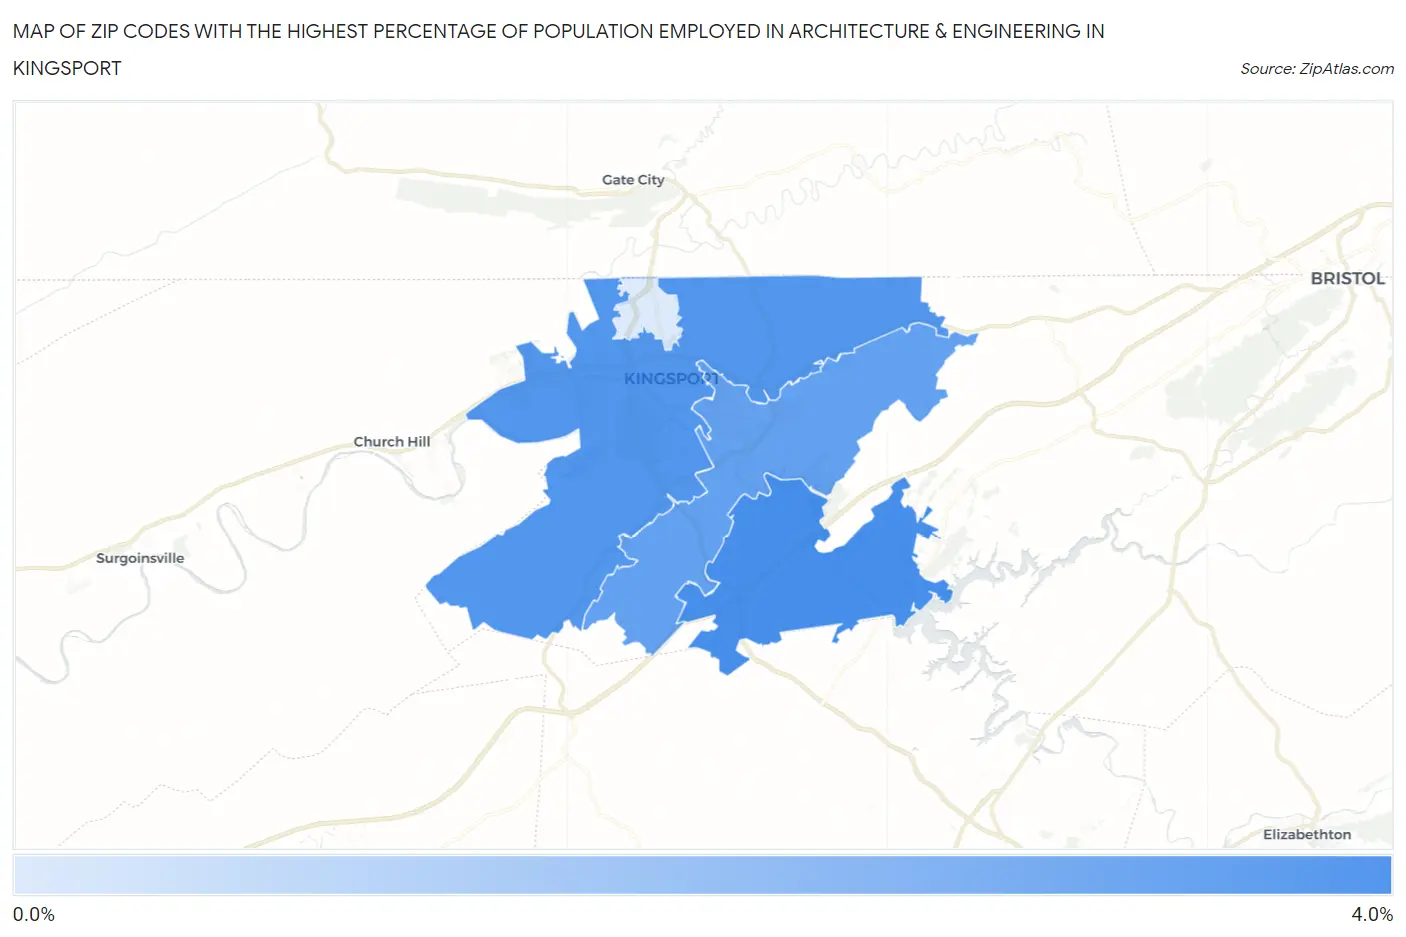
Map of Zip Codes with the Highest Percentage of Population Employed in Architecture & Engineering in Kingsport
0.0%
4.0%
Zip Codes with the Highest Percentage of Population Employed in Architecture & Engineering in Kingsport, TN
| Zip Code | % Employed | vs State | vs National | |
| 1. | 37663 | 3.4% | 1.7%(+1.77)#55 | 2.1%(+1.29)#3,875 |
| 2. | 37660 | 3.2% | 1.7%(+1.56)#64 | 2.1%(+1.07)#4,407 |
| 3. | 37664 | 2.9% | 1.7%(+1.25)#83 | 2.1%(+0.768)#5,369 |
| 4. | 37665 | 0.73% | 1.7%(-0.940)#382 | 2.1%(-1.42)#18,704 |
1
Common Questions
What are the Top 3 Zip Codes with the Highest Percentage of Population Employed in Architecture & Engineering in Kingsport, TN?
Top 3 Zip Codes with the Highest Percentage of Population Employed in Architecture & Engineering in Kingsport, TN are:
What zip code has the Highest Percentage of Population Employed in Architecture & Engineering in Kingsport, TN?
37663 has the Highest Percentage of Population Employed in Architecture & Engineering in Kingsport, TN with 3.4%.
What is the Percentage of Population Employed in Architecture & Engineering in Kingsport, TN?
Percentage of Population Employed in Architecture & Engineering in Kingsport is 3.0%.
What is the Percentage of Population Employed in Architecture & Engineering in Tennessee?
Percentage of Population Employed in Architecture & Engineering in Tennessee is 1.7%.
What is the Percentage of Population Employed in Architecture & Engineering in the United States?
Percentage of Population Employed in Architecture & Engineering in the United States is 2.1%.