Zip Codes with the Highest Percentage of Population Employed in Accommodation & Food Services in Clarksville, TN
RELATED REPORTS & OPTIONS
Accommodation & Food Services
Clarksville
Compare Zip Codes
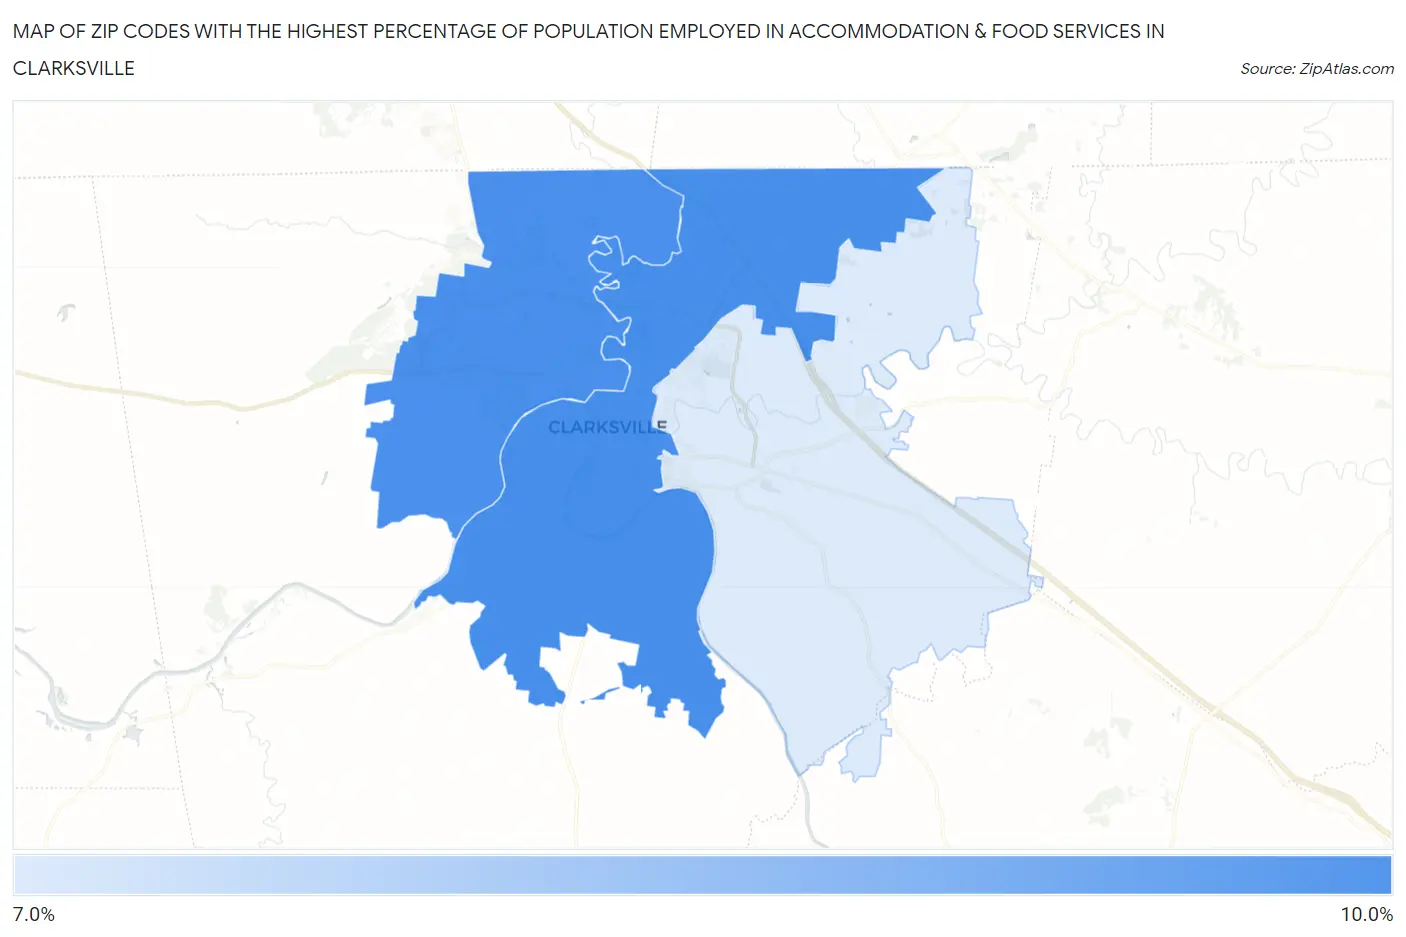
Map of Zip Codes with the Highest Percentage of Population Employed in Accommodation & Food Services in Clarksville
0.0%
10.0%
Zip Codes with the Highest Percentage of Population Employed in Accommodation & Food Services in Clarksville, TN
| Zip Code | % Employed | vs State | vs National | |
| 1. | 37040 | 9.6% | 7.4%(+2.21)#107 | 6.9%(+2.72)#5,058 |
| 2. | 37042 | 9.6% | 7.4%(+2.16)#109 | 6.9%(+2.67)#5,144 |
| 3. | 37043 | 7.3% | 7.4%(-0.094)#206 | 6.9%(+0.417)#9,534 |
1
Common Questions
What are the Top Zip Codes with the Highest Percentage of Population Employed in Accommodation & Food Services in Clarksville, TN?
Top Zip Codes with the Highest Percentage of Population Employed in Accommodation & Food Services in Clarksville, TN are:
What zip code has the Highest Percentage of Population Employed in Accommodation & Food Services in Clarksville, TN?
37040 has the Highest Percentage of Population Employed in Accommodation & Food Services in Clarksville, TN with 9.6%.
What is the Percentage of Population Employed in Accommodation & Food Services in Clarksville, TN?
Percentage of Population Employed in Accommodation & Food Services in Clarksville is 9.8%.
What is the Percentage of Population Employed in Accommodation & Food Services in Tennessee?
Percentage of Population Employed in Accommodation & Food Services in Tennessee is 7.4%.
What is the Percentage of Population Employed in Accommodation & Food Services in the United States?
Percentage of Population Employed in Accommodation & Food Services in the United States is 6.9%.