Tongan vs Immigrants from India Receiving Food Stamps
COMPARE
Tongan
Immigrants from India
Receiving Food Stamps
Receiving Food Stamps Comparison
Tongans
Immigrants from India
9.7%
RECEIVING FOOD STAMPS
99.3/ 100
METRIC RATING
53rd/ 347
METRIC RANK
7.4%
RECEIVING FOOD STAMPS
100.0/ 100
METRIC RATING
2nd/ 347
METRIC RANK
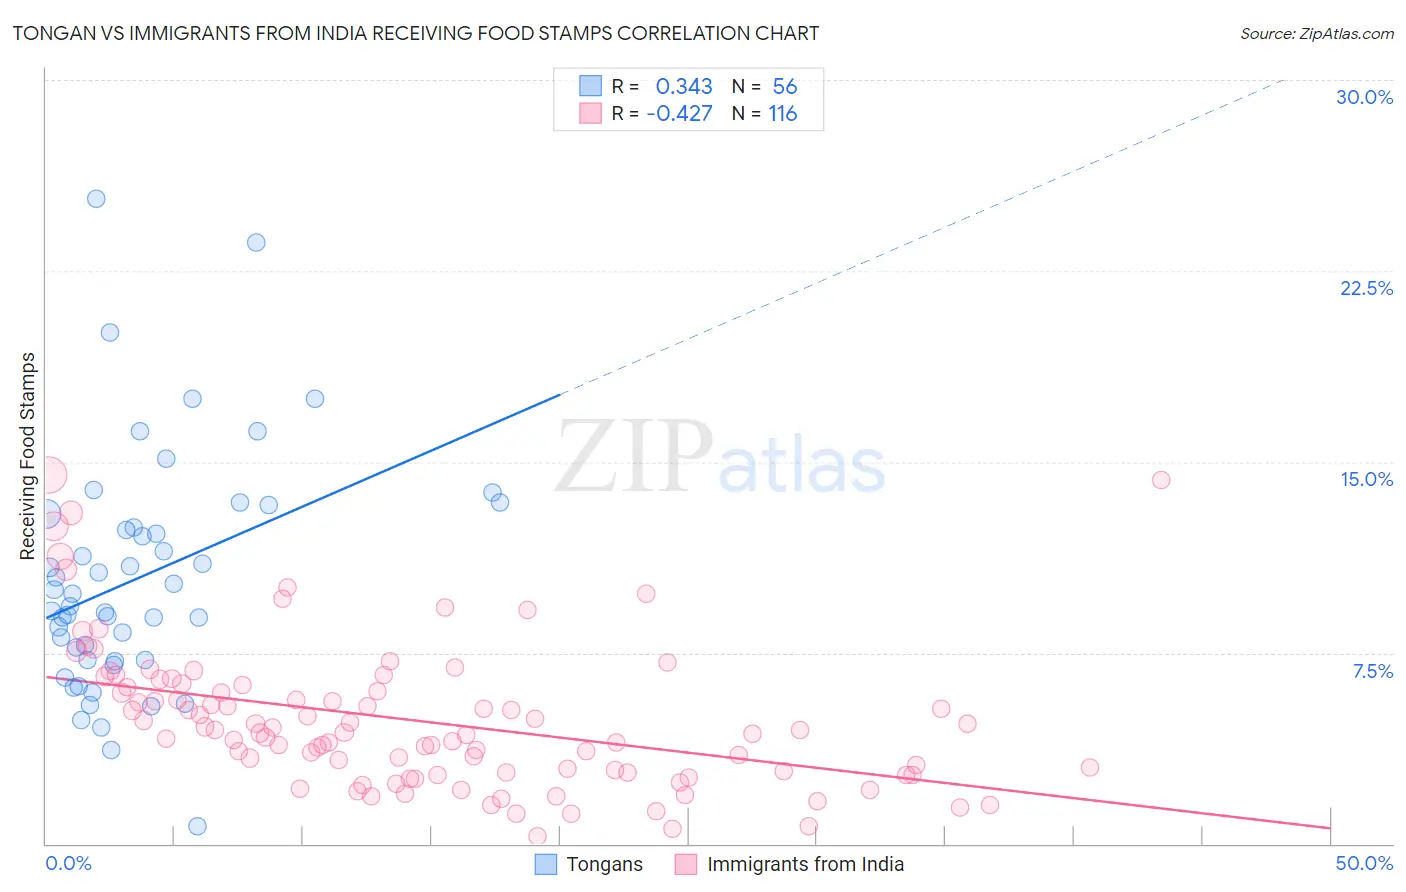
Tongan vs Immigrants from India Receiving Food Stamps Correlation Chart
The statistical analysis conducted on geographies consisting of 102,835,812 people shows a mild positive correlation between the proportion of Tongans and percentage of population receiving government assistance and/or food stamps in the United States with a correlation coefficient (R) of 0.343 and weighted average of 9.7%. Similarly, the statistical analysis conducted on geographies consisting of 432,357,413 people shows a moderate negative correlation between the proportion of Immigrants from India and percentage of population receiving government assistance and/or food stamps in the United States with a correlation coefficient (R) of -0.427 and weighted average of 7.4%, a difference of 31.4%.
Receiving Food Stamps Correlation Summary
| Measurement | Tongan | Immigrants from India |
| Minimum | 0.70% | 0.30% |
| Maximum | 25.4% | 14.5% |
| Range | 24.7% | 14.2% |
| Mean | 10.4% | 4.8% |
| Median | 9.6% | 4.4% |
| Interquartile 25% (IQ1) | 7.2% | 2.8% |
| Interquartile 75% (IQ3) | 12.7% | 6.2% |
| Interquartile Range (IQR) | 5.5% | 3.4% |
| Standard Deviation (Sample) | 4.7% | 2.8% |
| Standard Deviation (Population) | 4.6% | 2.8% |
Similar Demographics by Receiving Food Stamps
Demographics Similar to Tongans by Receiving Food Stamps
In terms of receiving food stamps, the demographic groups most similar to Tongans are Immigrants from South Africa (9.7%, a difference of 0.010%), Asian (9.7%, a difference of 0.030%), Swiss (9.7%, a difference of 0.12%), Immigrants from Switzerland (9.7%, a difference of 0.13%), and Lithuanian (9.7%, a difference of 0.21%).
| Demographics | Rating | Rank | Receiving Food Stamps |
| Australians | 99.4 /100 | #46 | Exceptional 9.6% |
| Indians (Asian) | 99.4 /100 | #47 | Exceptional 9.6% |
| Russians | 99.4 /100 | #48 | Exceptional 9.6% |
| Immigrants | Czechoslovakia | 99.4 /100 | #49 | Exceptional 9.6% |
| Lithuanians | 99.4 /100 | #50 | Exceptional 9.7% |
| Asians | 99.3 /100 | #51 | Exceptional 9.7% |
| Immigrants | South Africa | 99.3 /100 | #52 | Exceptional 9.7% |
| Tongans | 99.3 /100 | #53 | Exceptional 9.7% |
| Swiss | 99.3 /100 | #54 | Exceptional 9.7% |
| Immigrants | Switzerland | 99.3 /100 | #55 | Exceptional 9.7% |
| Immigrants | Canada | 99.3 /100 | #56 | Exceptional 9.7% |
| Greeks | 99.3 /100 | #57 | Exceptional 9.7% |
| Scandinavians | 99.2 /100 | #58 | Exceptional 9.7% |
| British | 99.2 /100 | #59 | Exceptional 9.7% |
| Germans | 99.2 /100 | #60 | Exceptional 9.7% |
Demographics Similar to Immigrants from India by Receiving Food Stamps
In terms of receiving food stamps, the demographic groups most similar to Immigrants from India are Filipino (7.4%, a difference of 0.28%), Immigrants from Taiwan (7.3%, a difference of 0.87%), Iranian (7.9%, a difference of 7.6%), Thai (8.1%, a difference of 10.0%), and Immigrants from Singapore (8.3%, a difference of 12.6%).
| Demographics | Rating | Rank | Receiving Food Stamps |
| Immigrants | Taiwan | 100.0 /100 | #1 | Exceptional 7.3% |
| Immigrants | India | 100.0 /100 | #2 | Exceptional 7.4% |
| Filipinos | 100.0 /100 | #3 | Exceptional 7.4% |
| Iranians | 100.0 /100 | #4 | Exceptional 7.9% |
| Thais | 100.0 /100 | #5 | Exceptional 8.1% |
| Immigrants | Singapore | 100.0 /100 | #6 | Exceptional 8.3% |
| Immigrants | Iran | 100.0 /100 | #7 | Exceptional 8.3% |
| Burmese | 99.9 /100 | #8 | Exceptional 8.6% |
| Immigrants | Korea | 99.9 /100 | #9 | Exceptional 8.7% |
| Immigrants | South Central Asia | 99.9 /100 | #10 | Exceptional 8.8% |
| Okinawans | 99.9 /100 | #11 | Exceptional 8.9% |
| Cypriots | 99.9 /100 | #12 | Exceptional 8.9% |
| Bulgarians | 99.9 /100 | #13 | Exceptional 8.9% |
| Maltese | 99.9 /100 | #14 | Exceptional 8.9% |
| Norwegians | 99.9 /100 | #15 | Exceptional 9.0% |