Immigrants from Switzerland vs French Receiving Food Stamps
COMPARE
Immigrants from Switzerland
French
Receiving Food Stamps
Receiving Food Stamps Comparison
Immigrants from Switzerland
French
9.7%
RECEIVING FOOD STAMPS
99.3/ 100
METRIC RATING
55th/ 347
METRIC RANK
10.7%
RECEIVING FOOD STAMPS
92.3/ 100
METRIC RATING
131st/ 347
METRIC RANK
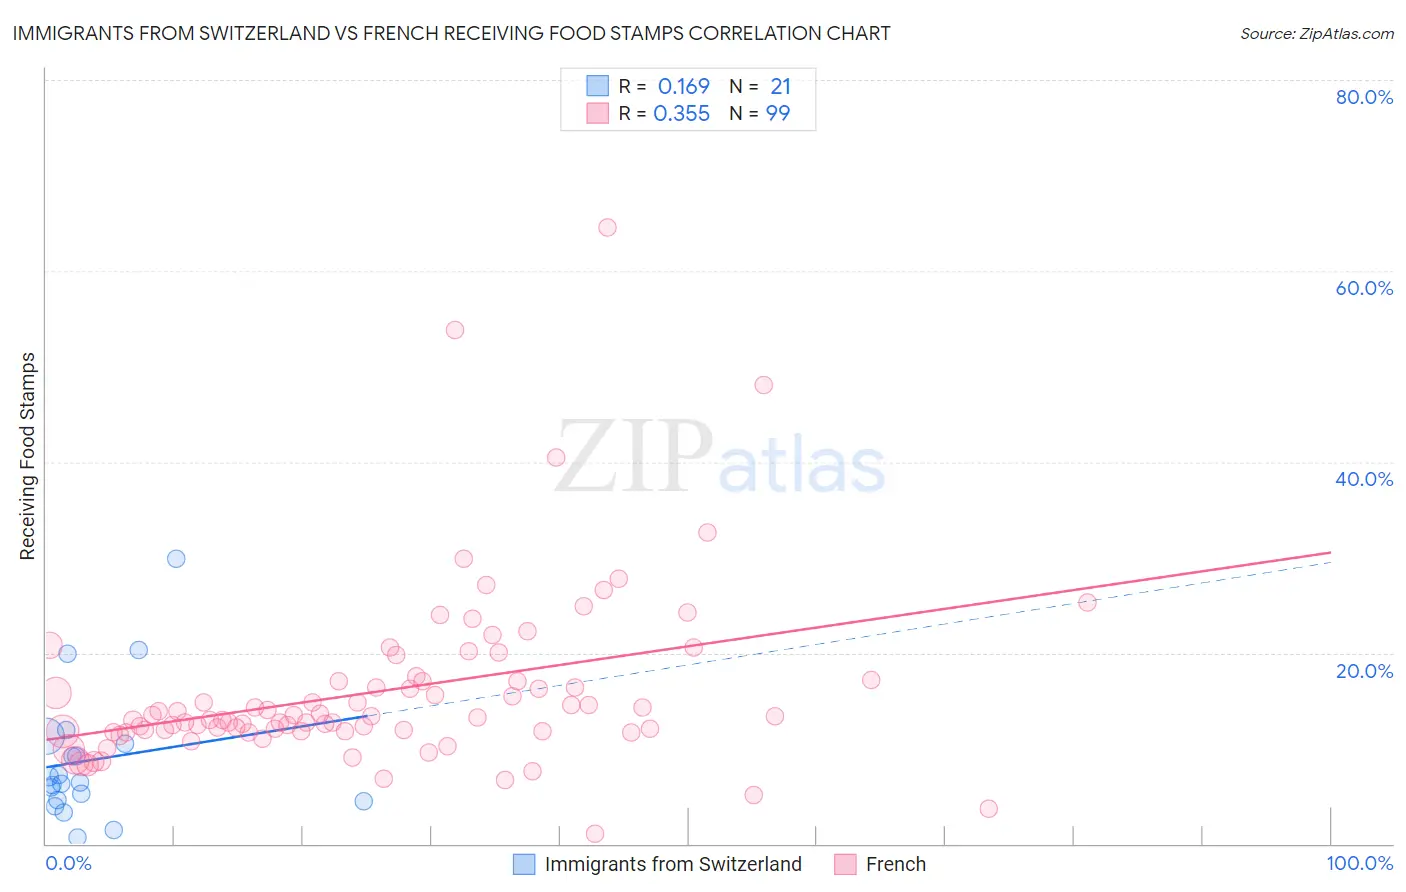
Immigrants from Switzerland vs French Receiving Food Stamps Correlation Chart
The statistical analysis conducted on geographies consisting of 147,876,791 people shows a poor positive correlation between the proportion of Immigrants from Switzerland and percentage of population receiving government assistance and/or food stamps in the United States with a correlation coefficient (R) of 0.169 and weighted average of 9.7%. Similarly, the statistical analysis conducted on geographies consisting of 568,765,352 people shows a mild positive correlation between the proportion of French and percentage of population receiving government assistance and/or food stamps in the United States with a correlation coefficient (R) of 0.355 and weighted average of 10.7%, a difference of 10.5%.
Receiving Food Stamps Correlation Summary
| Measurement | Immigrants from Switzerland | French |
| Minimum | 0.61% | 1.1% |
| Maximum | 29.9% | 64.6% |
| Range | 29.3% | 63.5% |
| Mean | 8.8% | 16.0% |
| Median | 6.5% | 13.3% |
| Interquartile 25% (IQ1) | 4.5% | 11.8% |
| Interquartile 75% (IQ3) | 10.9% | 17.1% |
| Interquartile Range (IQR) | 6.3% | 5.3% |
| Standard Deviation (Sample) | 7.0% | 9.4% |
| Standard Deviation (Population) | 6.8% | 9.3% |
Similar Demographics by Receiving Food Stamps
Demographics Similar to Immigrants from Switzerland by Receiving Food Stamps
In terms of receiving food stamps, the demographic groups most similar to Immigrants from Switzerland are Swiss (9.7%, a difference of 0.010%), Tongan (9.7%, a difference of 0.13%), Immigrants from South Africa (9.7%, a difference of 0.14%), Asian (9.7%, a difference of 0.16%), and Immigrants from Canada (9.7%, a difference of 0.18%).
| Demographics | Rating | Rank | Receiving Food Stamps |
| Russians | 99.4 /100 | #48 | Exceptional 9.6% |
| Immigrants | Czechoslovakia | 99.4 /100 | #49 | Exceptional 9.6% |
| Lithuanians | 99.4 /100 | #50 | Exceptional 9.7% |
| Asians | 99.3 /100 | #51 | Exceptional 9.7% |
| Immigrants | South Africa | 99.3 /100 | #52 | Exceptional 9.7% |
| Tongans | 99.3 /100 | #53 | Exceptional 9.7% |
| Swiss | 99.3 /100 | #54 | Exceptional 9.7% |
| Immigrants | Switzerland | 99.3 /100 | #55 | Exceptional 9.7% |
| Immigrants | Canada | 99.3 /100 | #56 | Exceptional 9.7% |
| Greeks | 99.3 /100 | #57 | Exceptional 9.7% |
| Scandinavians | 99.2 /100 | #58 | Exceptional 9.7% |
| British | 99.2 /100 | #59 | Exceptional 9.7% |
| Germans | 99.2 /100 | #60 | Exceptional 9.7% |
| English | 99.2 /100 | #61 | Exceptional 9.8% |
| Immigrants | Bulgaria | 99.2 /100 | #62 | Exceptional 9.8% |
Demographics Similar to French by Receiving Food Stamps
In terms of receiving food stamps, the demographic groups most similar to French are Israeli (10.7%, a difference of 0.0%), Immigrants from Jordan (10.7%, a difference of 0.10%), Yugoslavian (10.7%, a difference of 0.10%), Immigrants from Ethiopia (10.7%, a difference of 0.11%), and Afghan (10.7%, a difference of 0.14%).
| Demographics | Rating | Rank | Receiving Food Stamps |
| Paraguayans | 93.0 /100 | #124 | Exceptional 10.7% |
| Ukrainians | 92.8 /100 | #125 | Exceptional 10.7% |
| Afghans | 92.6 /100 | #126 | Exceptional 10.7% |
| Immigrants | Ethiopia | 92.6 /100 | #127 | Exceptional 10.7% |
| Immigrants | Jordan | 92.5 /100 | #128 | Exceptional 10.7% |
| Yugoslavians | 92.5 /100 | #129 | Exceptional 10.7% |
| Israelis | 92.4 /100 | #130 | Exceptional 10.7% |
| French | 92.3 /100 | #131 | Exceptional 10.7% |
| Immigrants | Germany | 92.0 /100 | #132 | Exceptional 10.7% |
| Immigrants | Russia | 90.9 /100 | #133 | Exceptional 10.8% |
| Immigrants | Brazil | 90.3 /100 | #134 | Exceptional 10.8% |
| Argentineans | 90.2 /100 | #135 | Exceptional 10.8% |
| Slovaks | 89.8 /100 | #136 | Excellent 10.8% |
| Immigrants | Eastern Europe | 89.8 /100 | #137 | Excellent 10.8% |
| Immigrants | Moldova | 88.5 /100 | #138 | Excellent 10.9% |