Immigrants from Spain vs Immigrants from Laos Child Poverty Among Girls Under 16

COMPARE

Immigrants from Spain
Race
Ancestry
AfghanAfricanAlaska NativeAlaskan AthabascanAlbanianAleutAlsatianAmericanApacheArabArapahoArgentineanArmenianAssyrian/Chaldean/SyriacAustralianAustrianBahamianBangladeshiBarbadianBasqueBelgianBelizeanBermudanBhutaneseBlackfeetBolivianBrazilianBritishBritish West IndianBulgarianBurmeseCajunCambodianCanadianCape VerdeanCarpatho RusynCelticCentral AmericanCentral American IndianCherokeeCheyenneChickasawChileanChineseChippewaChoctawColombianColvilleComancheCosta RicanCreeCreekCroatianCrowCubanCypriotCzechCzechoslovakianDanishDelawareDominicanDutchDutch West IndianEastern EuropeanEcuadorianEgyptianEnglishEstonianEthiopianEuropeanFijianFilipinoFinnishFrenchFrench American IndianFrench CanadianGermanGerman RussianGhanaianGreekGuamanian/ChamorroGuatemalanGuyaneseHaitianHmongHonduranHopiHoumaHungarianIcelanderIndian (Asian)IndonesianInupiatIranianIraqiIrishIroquoisIsraeliItalianJamaicanJapaneseJordanianKenyanKiowaKoreanLaotianLatvianLebaneseLiberianLithuanianLumbeeLuxembourgerMacedonianMalaysianMalteseMarshalleseMenomineeMexicanMexican American IndianMongolianMoroccanNative HawaiianNavajoNepaleseNew ZealanderNicaraguanNigerianNorthern EuropeanNorwegianOkinawanOsageOttawaPaiutePakistaniPalestinianPanamanianParaguayanPennsylvania GermanPeruvianPimaPolishPortuguesePotawatomiPuebloPuerto RicanPuget Sound SalishRomanianRussianSalvadoranSamoanScandinavianScotch-IrishScottishSeminoleSenegaleseSerbianShoshoneSierra LeoneanSiouxSlavicSlovakSloveneSomaliSouth AfricanSouth AmericanSouth American IndianSoviet UnionSpaniardSpanishSpanish AmericanSpanish American IndianSri LankanSubsaharan AfricanSudaneseSwedishSwissSyrianTaiwaneseThaiTlingit-HaidaTohono O'OdhamTonganTrinidadian and TobagonianTsimshianTurkishU.S. Virgin IslanderUgandanUkrainianUruguayanUteVenezuelanVietnameseWelshWest IndianYakamaYaquiYugoslavianYumanYup'ikZimbabwean
Immigration
NonimmigrantsImmigrantsAfghanistanAfricaAlbaniaArgentinaArmeniaAsiaAustraliaAustriaBahamasBangladeshBarbadosBelarusBelgiumBelizeBoliviaBosnia and HerzegovinaBrazilBulgariaBurma/MyanmarCabo VerdeCambodiaCameroonCanadaCaribbeanCentral AmericaChileChinaColombiaCongoCosta RicaCroatiaCubaCzechoslovakiaDenmarkDominicaDominican RepublicEastern AfricaEastern AsiaEastern EuropeEcuadorEgyptEl SalvadorEnglandEritreaEthiopiaEuropeFijiFranceGermanyGhanaGreeceGrenadaGuatemalaGuyanaHaitiHondurasHong KongHungaryIndiaIndonesiaIranIraqIrelandIsraelItalyJamaicaJapanJordanKazakhstanKenyaKoreaKuwaitLatin AmericaLatviaLebanonLiberiaLithuaniaMalaysiaMexicoMicronesiaMiddle AfricaMoldovaMoroccoNepalNetherlandsNicaraguaNigeriaNorth AmericaNorth MacedoniaNorthern AfricaNorthern EuropeNorwayOceaniaPakistanPanamaPeruPhilippinesPolandPortugalRomaniaRussiaSaudi ArabiaScotlandSenegalSerbiaSierra LeoneSingaporeSomaliaSouth AfricaSouth AmericaSouth Central AsiaSouth Eastern AsiaSouthern EuropeSpainSri LankaSt. Vincent and the GrenadinesSudanSwedenSwitzerlandSyriaTaiwanThailandTrinidad and TobagoTurkeyUgandaUkraineUruguayUzbekistanVenezuelaVietnamWest IndiesWestern AfricaWestern AsiaWestern EuropeYemenZaireZimbabweAzores
Immigrants from Laos
Race
Ancestry
AfghanAfricanAlaska NativeAlaskan AthabascanAlbanianAleutAlsatianAmericanApacheArabArapahoArgentineanArmenianAssyrian/Chaldean/SyriacAustralianAustrianBahamianBangladeshiBarbadianBasqueBelgianBelizeanBermudanBhutaneseBlackfeetBolivianBrazilianBritishBritish West IndianBulgarianBurmeseCajunCambodianCanadianCape VerdeanCarpatho RusynCelticCentral AmericanCentral American IndianCherokeeCheyenneChickasawChileanChineseChippewaChoctawColombianColvilleComancheCosta RicanCreeCreekCroatianCrowCubanCypriotCzechCzechoslovakianDanishDelawareDominicanDutchDutch West IndianEastern EuropeanEcuadorianEgyptianEnglishEstonianEthiopianEuropeanFijianFilipinoFinnishFrenchFrench American IndianFrench CanadianGermanGerman RussianGhanaianGreekGuamanian/ChamorroGuatemalanGuyaneseHaitianHmongHonduranHopiHoumaHungarianIcelanderIndian (Asian)IndonesianInupiatIranianIraqiIrishIroquoisIsraeliItalianJamaicanJapaneseJordanianKenyanKiowaKoreanLaotianLatvianLebaneseLiberianLithuanianLumbeeLuxembourgerMacedonianMalaysianMalteseMarshalleseMenomineeMexicanMexican American IndianMongolianMoroccanNative HawaiianNavajoNepaleseNew ZealanderNicaraguanNigerianNorthern EuropeanNorwegianOkinawanOsageOttawaPaiutePakistaniPalestinianPanamanianParaguayanPennsylvania GermanPeruvianPimaPolishPortuguesePotawatomiPuebloPuerto RicanPuget Sound SalishRomanianRussianSalvadoranSamoanScandinavianScotch-IrishScottishSeminoleSenegaleseSerbianShoshoneSierra LeoneanSiouxSlavicSlovakSloveneSomaliSouth AfricanSouth AmericanSouth American IndianSoviet UnionSpaniardSpanishSpanish AmericanSpanish American IndianSri LankanSubsaharan AfricanSudaneseSwedishSwissSyrianTaiwaneseThaiTlingit-HaidaTohono O'OdhamTonganTrinidadian and TobagonianTsimshianTurkishU.S. Virgin IslanderUgandanUkrainianUruguayanUteVenezuelanVietnameseWelshWest IndianYakamaYaquiYugoslavianYumanYup'ikZimbabwean
Immigration
NonimmigrantsImmigrantsAfghanistanAfricaAlbaniaArgentinaArmeniaAsiaAustraliaAustriaBahamasBangladeshBarbadosBelarusBelgiumBelizeBoliviaBosnia and HerzegovinaBrazilBulgariaBurma/MyanmarCabo VerdeCambodiaCameroonCanadaCaribbeanCentral AmericaChileChinaColombiaCongoCosta RicaCroatiaCubaCzechoslovakiaDenmarkDominicaDominican RepublicEastern AfricaEastern AsiaEastern EuropeEcuadorEgyptEl SalvadorEnglandEritreaEthiopiaEuropeFijiFranceGermanyGhanaGreeceGrenadaGuatemalaGuyanaHaitiHondurasHong KongHungaryIndiaIndonesiaIranIraqIrelandIsraelItalyJamaicaJapanJordanKazakhstanKenyaKoreaKuwaitLaosLatin AmericaLatviaLebanonLiberiaLithuaniaMalaysiaMexicoMicronesiaMiddle AfricaMoldovaMoroccoNepalNetherlandsNicaraguaNigeriaNorth AmericaNorth MacedoniaNorthern AfricaNorthern EuropeNorwayOceaniaPakistanPanamaPeruPhilippinesPolandPortugalRomaniaRussiaSaudi ArabiaScotlandSenegalSerbiaSierra LeoneSingaporeSomaliaSouth AfricaSouth AmericaSouth Central AsiaSouth Eastern AsiaSouthern EuropeSri LankaSt. Vincent and the GrenadinesSudanSwedenSwitzerlandSyriaTaiwanThailandTrinidad and TobagoTurkeyUgandaUkraineUruguayUzbekistanVenezuelaVietnamWest IndiesWestern AfricaWestern AsiaWestern EuropeYemenZaireZimbabweAzores
Child Poverty Among Girls Under 16
Income
Poverty
Unemployment
Labor Participation
Family Structure
Vehicle Availability
Education Level
Disability

Child Poverty Among Girls Under 16 Comparison

Immigrants from Spain

Immigrants from Laos

Excellent
Tragic
15.5%
CHILD POVERTY AMONG GIRLS UNDER 16
89.1/ 100
METRIC RATING
134th/ 347
METRIC RANK
18.9%
CHILD POVERTY AMONG GIRLS UNDER 16
0.6/ 100
METRIC RATING
246th/ 347
METRIC RANK

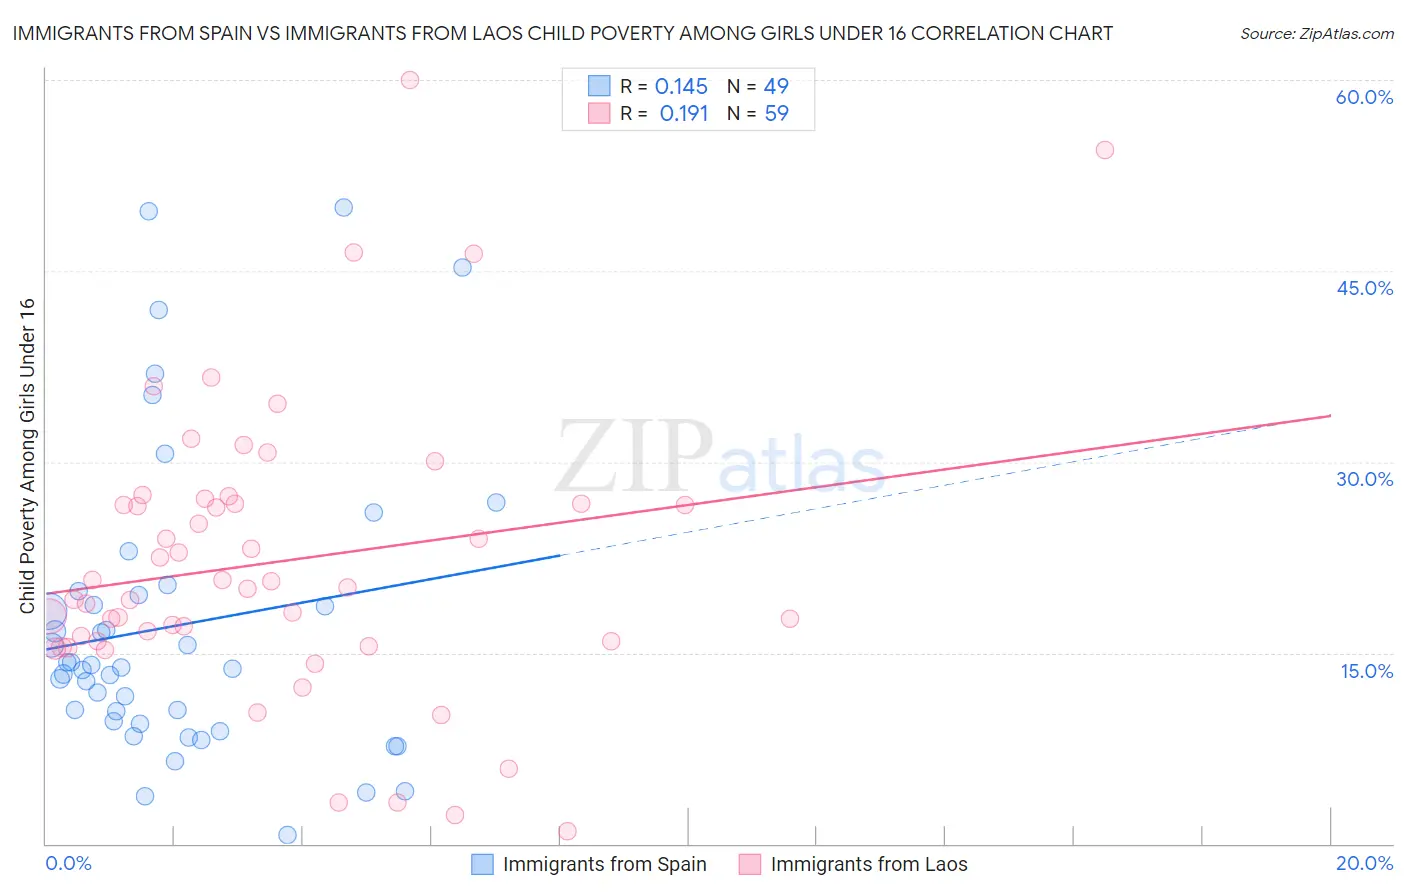
Immigrants from Spain vs Immigrants from Laos Child Poverty Among Girls Under 16 Correlation Chart

The statistical analysis conducted on geographies consisting of 236,761,138 people shows a poor positive correlation between the proportion of Immigrants from Spain and poverty level among girls under the age of 16 in the United States with a correlation coefficient (R) of 0.145 and weighted average of 15.5%. Similarly, the statistical analysis conducted on geographies consisting of 199,827,188 people shows a poor positive correlation between the proportion of Immigrants from Laos and poverty level among girls under the age of 16 in the United States with a correlation coefficient (R) of 0.191 and weighted average of 18.9%, a difference of 22.0%.
Immigrants from Spain vs Immigrants from Laos Child Poverty Among Girls Under 16

Child Poverty Among Girls Under 16 Correlation Summary

MeasurementImmigrants from SpainImmigrants from Laos
Minimum0.69%1.0%
Maximum50.0%60.0%
Range49.3%59.0%
Mean17.1%22.2%
Median13.8%20.1%
Interquartile 25% (IQ1)9.5%15.9%
Interquartile 75% (IQ3)19.7%26.8%
Interquartile Range (IQR)10.2%10.9%
Standard Deviation (Sample)11.7%11.4%
Standard Deviation (Population)11.5%11.3%

Similar Demographics by Child Poverty Among Girls Under 16

Demographics Similar to Immigrants from Spain by Child Poverty Among Girls Under 16

In terms of child poverty among girls under 16, the demographic groups most similar to Immigrants from Spain are Czechoslovakian (15.5%, a difference of 0.030%), Native Hawaiian (15.5%, a difference of 0.050%), South African (15.5%, a difference of 0.14%), Brazilian (15.4%, a difference of 0.16%), and Mongolian (15.4%, a difference of 0.17%).
DemographicsRating | RankChild Poverty Among Girls Under 16
Immigrants | Norway
90.8
/100
|
#127
Exceptional
15.4%
Albanians
90.5
/100
|
#128
Exceptional
15.4%
Immigrants | South Eastern Asia
90.5
/100
|
#129
Exceptional
15.4%
Puget Sound Salish
90.1
/100
|
#130
Exceptional
15.4%
Immigrants | Western Europe
90.0
/100
|
#131
Exceptional
15.4%
Mongolians
89.7
/100
|
#132
Excellent
15.4%
Brazilians
89.6
/100
|
#133
Excellent
15.4%
Immigrants | Spain
89.1
/100
|
#134
Excellent
15.5%
Czechoslovakians
89.0
/100
|
#135
Excellent
15.5%
Native Hawaiians
89.0
/100
|
#136
Excellent
15.5%
South Africans
88.7
/100
|
#137
Excellent
15.5%
Immigrants | Vietnam
88.2
/100
|
#138
Excellent
15.5%
Armenians
87.9
/100
|
#139
Excellent
15.5%
New Zealanders
87.2
/100
|
#140
Excellent
15.6%
Immigrants | Jordan
87.2
/100
|
#141
Excellent
15.6%

Demographics Similar to Immigrants from Laos by Child Poverty Among Girls Under 16

In terms of child poverty among girls under 16, the demographic groups most similar to Immigrants from Laos are Shoshone (18.9%, a difference of 0.030%), Ecuadorian (18.8%, a difference of 0.14%), Immigrants from Nicaragua (18.8%, a difference of 0.21%), Immigrants from Ghana (18.9%, a difference of 0.37%), and Immigrants from Cuba (18.8%, a difference of 0.43%).
DemographicsRating | RankChild Poverty Among Girls Under 16
Marshallese
0.9
/100
|
#239
Tragic
18.7%
Nigerians
0.9
/100
|
#240
Tragic
18.7%
Americans
0.8
/100
|
#241
Tragic
18.8%
Immigrants | Cuba
0.7
/100
|
#242
Tragic
18.8%
Immigrants | Nicaragua
0.7
/100
|
#243
Tragic
18.8%
Ecuadorians
0.7
/100
|
#244
Tragic
18.8%
Shoshone
0.6
/100
|
#245
Tragic
18.9%
Immigrants | Laos
0.6
/100
|
#246
Tragic
18.9%
Immigrants | Ghana
0.5
/100
|
#247
Tragic
18.9%
French American Indians
0.3
/100
|
#248
Tragic
19.2%
Potawatomi
0.3
/100
|
#249
Tragic
19.2%
Cape Verdeans
0.3
/100
|
#250
Tragic
19.2%
Immigrants | Trinidad and Tobago
0.3
/100
|
#251
Tragic
19.2%
Immigrants | Middle Africa
0.3
/100
|
#252
Tragic
19.2%
Immigrants | Guyana
0.3
/100
|
#253
Tragic
19.3%