Immigrants from Spain vs Immigrants from South Africa Child Poverty Among Girls Under 16

COMPARE

Immigrants from Spain
Race
Ancestry
AfghanAfricanAlaska NativeAlaskan AthabascanAlbanianAleutAlsatianAmericanApacheArabArapahoArgentineanArmenianAssyrian/Chaldean/SyriacAustralianAustrianBahamianBangladeshiBarbadianBasqueBelgianBelizeanBermudanBhutaneseBlackfeetBolivianBrazilianBritishBritish West IndianBulgarianBurmeseCajunCambodianCanadianCape VerdeanCarpatho RusynCelticCentral AmericanCentral American IndianCherokeeCheyenneChickasawChileanChineseChippewaChoctawColombianColvilleComancheCosta RicanCreeCreekCroatianCrowCubanCypriotCzechCzechoslovakianDanishDelawareDominicanDutchDutch West IndianEastern EuropeanEcuadorianEgyptianEnglishEstonianEthiopianEuropeanFijianFilipinoFinnishFrenchFrench American IndianFrench CanadianGermanGerman RussianGhanaianGreekGuamanian/ChamorroGuatemalanGuyaneseHaitianHmongHonduranHopiHoumaHungarianIcelanderIndian (Asian)IndonesianInupiatIranianIraqiIrishIroquoisIsraeliItalianJamaicanJapaneseJordanianKenyanKiowaKoreanLaotianLatvianLebaneseLiberianLithuanianLumbeeLuxembourgerMacedonianMalaysianMalteseMarshalleseMenomineeMexicanMexican American IndianMongolianMoroccanNative HawaiianNavajoNepaleseNew ZealanderNicaraguanNigerianNorthern EuropeanNorwegianOkinawanOsageOttawaPaiutePakistaniPalestinianPanamanianParaguayanPennsylvania GermanPeruvianPimaPolishPortuguesePotawatomiPuebloPuerto RicanPuget Sound SalishRomanianRussianSalvadoranSamoanScandinavianScotch-IrishScottishSeminoleSenegaleseSerbianShoshoneSierra LeoneanSiouxSlavicSlovakSloveneSomaliSouth AfricanSouth AmericanSouth American IndianSoviet UnionSpaniardSpanishSpanish AmericanSpanish American IndianSri LankanSubsaharan AfricanSudaneseSwedishSwissSyrianTaiwaneseThaiTlingit-HaidaTohono O'OdhamTonganTrinidadian and TobagonianTsimshianTurkishU.S. Virgin IslanderUgandanUkrainianUruguayanUteVenezuelanVietnameseWelshWest IndianYakamaYaquiYugoslavianYumanYup'ikZimbabwean
Immigration
NonimmigrantsImmigrantsAfghanistanAfricaAlbaniaArgentinaArmeniaAsiaAustraliaAustriaBahamasBangladeshBarbadosBelarusBelgiumBelizeBoliviaBosnia and HerzegovinaBrazilBulgariaBurma/MyanmarCabo VerdeCambodiaCameroonCanadaCaribbeanCentral AmericaChileChinaColombiaCongoCosta RicaCroatiaCubaCzechoslovakiaDenmarkDominicaDominican RepublicEastern AfricaEastern AsiaEastern EuropeEcuadorEgyptEl SalvadorEnglandEritreaEthiopiaEuropeFijiFranceGermanyGhanaGreeceGrenadaGuatemalaGuyanaHaitiHondurasHong KongHungaryIndiaIndonesiaIranIraqIrelandIsraelItalyJamaicaJapanJordanKazakhstanKenyaKoreaKuwaitLaosLatin AmericaLatviaLebanonLiberiaLithuaniaMalaysiaMexicoMicronesiaMiddle AfricaMoldovaMoroccoNepalNetherlandsNicaraguaNigeriaNorth AmericaNorth MacedoniaNorthern AfricaNorthern EuropeNorwayOceaniaPakistanPanamaPeruPhilippinesPolandPortugalRomaniaRussiaSaudi ArabiaScotlandSenegalSerbiaSierra LeoneSingaporeSomaliaSouth AmericaSouth Central AsiaSouth Eastern AsiaSouthern EuropeSpainSri LankaSt. Vincent and the GrenadinesSudanSwedenSwitzerlandSyriaTaiwanThailandTrinidad and TobagoTurkeyUgandaUkraineUruguayUzbekistanVenezuelaVietnamWest IndiesWestern AfricaWestern AsiaWestern EuropeYemenZaireZimbabweAzores
Immigrants from South Africa
Race
Ancestry
AfghanAfricanAlaska NativeAlaskan AthabascanAlbanianAleutAlsatianAmericanApacheArabArapahoArgentineanArmenianAssyrian/Chaldean/SyriacAustralianAustrianBahamianBangladeshiBarbadianBasqueBelgianBelizeanBermudanBhutaneseBlackfeetBolivianBrazilianBritishBritish West IndianBulgarianBurmeseCajunCambodianCanadianCape VerdeanCarpatho RusynCelticCentral AmericanCentral American IndianCherokeeCheyenneChickasawChileanChineseChippewaChoctawColombianColvilleComancheCosta RicanCreeCreekCroatianCrowCubanCypriotCzechCzechoslovakianDanishDelawareDominicanDutchDutch West IndianEastern EuropeanEcuadorianEgyptianEnglishEstonianEthiopianEuropeanFijianFilipinoFinnishFrenchFrench American IndianFrench CanadianGermanGerman RussianGhanaianGreekGuamanian/ChamorroGuatemalanGuyaneseHaitianHmongHonduranHopiHoumaHungarianIcelanderIndian (Asian)IndonesianInupiatIranianIraqiIrishIroquoisIsraeliItalianJamaicanJapaneseJordanianKenyanKiowaKoreanLaotianLatvianLebaneseLiberianLithuanianLumbeeLuxembourgerMacedonianMalaysianMalteseMarshalleseMenomineeMexicanMexican American IndianMongolianMoroccanNative HawaiianNavajoNepaleseNew ZealanderNicaraguanNigerianNorthern EuropeanNorwegianOkinawanOsageOttawaPaiutePakistaniPalestinianPanamanianParaguayanPennsylvania GermanPeruvianPimaPolishPortuguesePotawatomiPuebloPuerto RicanPuget Sound SalishRomanianRussianSalvadoranSamoanScandinavianScotch-IrishScottishSeminoleSenegaleseSerbianShoshoneSierra LeoneanSiouxSlavicSlovakSloveneSomaliSouth AfricanSouth AmericanSouth American IndianSoviet UnionSpaniardSpanishSpanish AmericanSpanish American IndianSri LankanSubsaharan AfricanSudaneseSwedishSwissSyrianTaiwaneseThaiTlingit-HaidaTohono O'OdhamTonganTrinidadian and TobagonianTsimshianTurkishU.S. Virgin IslanderUgandanUkrainianUruguayanUteVenezuelanVietnameseWelshWest IndianYakamaYaquiYugoslavianYumanYup'ikZimbabwean
Immigration
NonimmigrantsImmigrantsAfghanistanAfricaAlbaniaArgentinaArmeniaAsiaAustraliaAustriaBahamasBangladeshBarbadosBelarusBelgiumBelizeBoliviaBosnia and HerzegovinaBrazilBulgariaBurma/MyanmarCabo VerdeCambodiaCameroonCanadaCaribbeanCentral AmericaChileChinaColombiaCongoCosta RicaCroatiaCubaCzechoslovakiaDenmarkDominicaDominican RepublicEastern AfricaEastern AsiaEastern EuropeEcuadorEgyptEl SalvadorEnglandEritreaEthiopiaEuropeFijiFranceGermanyGhanaGreeceGrenadaGuatemalaGuyanaHaitiHondurasHong KongHungaryIndiaIndonesiaIranIraqIrelandIsraelItalyJamaicaJapanJordanKazakhstanKenyaKoreaKuwaitLaosLatin AmericaLatviaLebanonLiberiaLithuaniaMalaysiaMexicoMicronesiaMiddle AfricaMoldovaMoroccoNepalNetherlandsNicaraguaNigeriaNorth AmericaNorth MacedoniaNorthern AfricaNorthern EuropeNorwayOceaniaPakistanPanamaPeruPhilippinesPolandPortugalRomaniaRussiaSaudi ArabiaScotlandSenegalSerbiaSierra LeoneSingaporeSomaliaSouth AfricaSouth AmericaSouth Central AsiaSouth Eastern AsiaSouthern EuropeSri LankaSt. Vincent and the GrenadinesSudanSwedenSwitzerlandSyriaTaiwanThailandTrinidad and TobagoTurkeyUgandaUkraineUruguayUzbekistanVenezuelaVietnamWest IndiesWestern AfricaWestern AsiaWestern EuropeYemenZaireZimbabweAzores
Child Poverty Among Girls Under 16
Income
Poverty
Unemployment
Labor Participation
Family Structure
Vehicle Availability
Education Level
Disability

Child Poverty Among Girls Under 16 Comparison

Immigrants from Spain

Immigrants from South Africa

Excellent
Exceptional
15.5%
CHILD POVERTY AMONG GIRLS UNDER 16
89.1/ 100
METRIC RATING
134th/ 347
METRIC RANK
15.0%
CHILD POVERTY AMONG GIRLS UNDER 16
95.6/ 100
METRIC RATING
101st/ 347
METRIC RANK

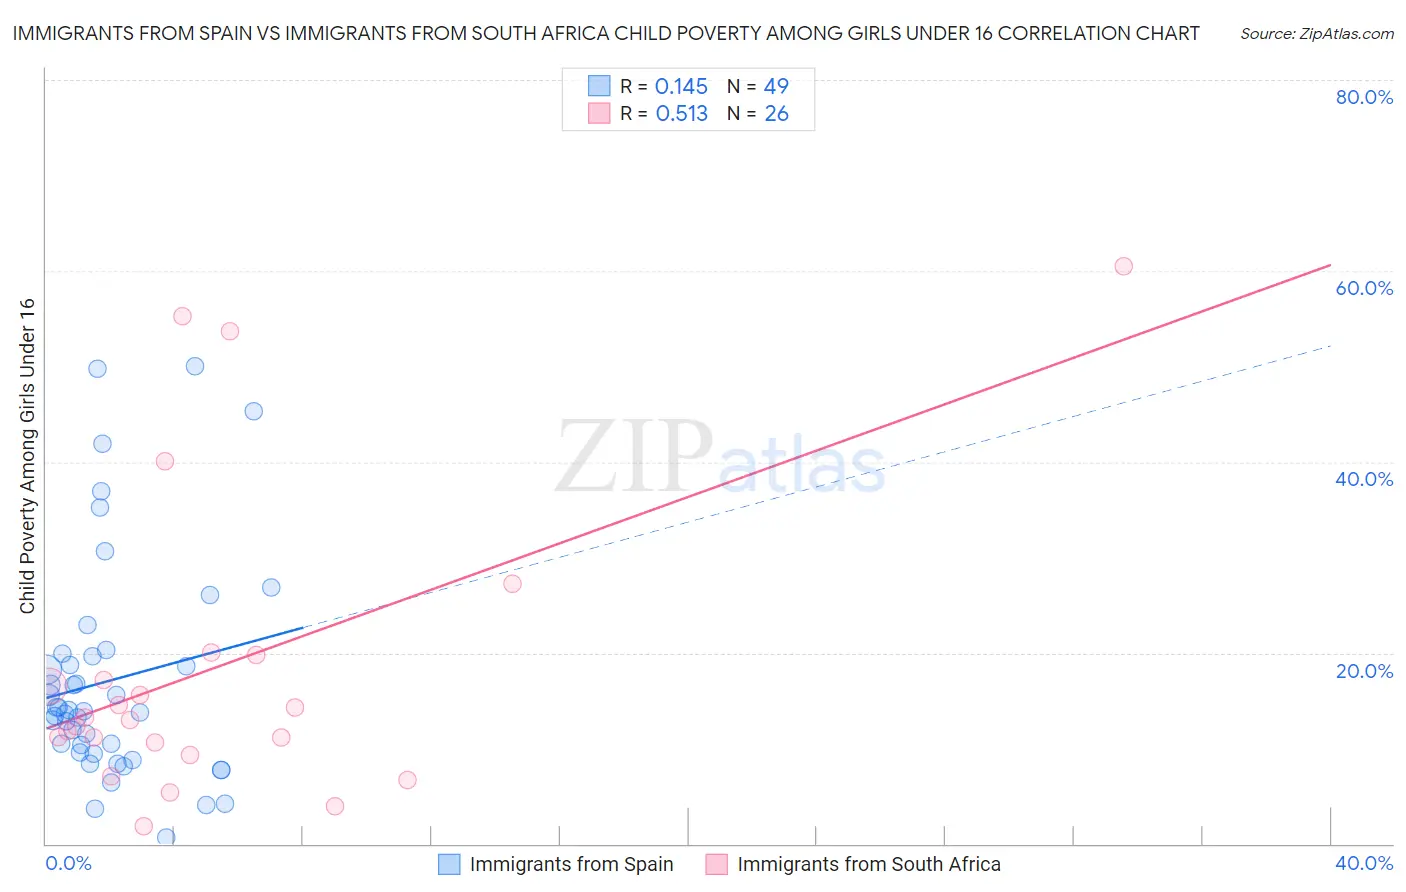
Immigrants from Spain vs Immigrants from South Africa Child Poverty Among Girls Under 16 Correlation Chart

The statistical analysis conducted on geographies consisting of 236,761,138 people shows a poor positive correlation between the proportion of Immigrants from Spain and poverty level among girls under the age of 16 in the United States with a correlation coefficient (R) of 0.145 and weighted average of 15.5%. Similarly, the statistical analysis conducted on geographies consisting of 230,120,116 people shows a substantial positive correlation between the proportion of Immigrants from South Africa and poverty level among girls under the age of 16 in the United States with a correlation coefficient (R) of 0.513 and weighted average of 15.0%, a difference of 3.1%.
Immigrants from Spain vs Immigrants from South Africa Child Poverty Among Girls Under 16

Child Poverty Among Girls Under 16 Correlation Summary

MeasurementImmigrants from SpainImmigrants from South Africa
Minimum0.69%1.8%
Maximum50.0%60.5%
Range49.3%58.6%
Mean17.1%18.6%
Median13.8%13.1%
Interquartile 25% (IQ1)9.5%10.6%
Interquartile 75% (IQ3)19.7%19.8%
Interquartile Range (IQR)10.2%9.2%
Standard Deviation (Sample)11.7%15.9%
Standard Deviation (Population)11.5%15.6%

Similar Demographics by Child Poverty Among Girls Under 16

Demographics Similar to Immigrants from Spain by Child Poverty Among Girls Under 16

In terms of child poverty among girls under 16, the demographic groups most similar to Immigrants from Spain are Czechoslovakian (15.5%, a difference of 0.030%), Native Hawaiian (15.5%, a difference of 0.050%), South African (15.5%, a difference of 0.14%), Brazilian (15.4%, a difference of 0.16%), and Mongolian (15.4%, a difference of 0.17%).
DemographicsRating | RankChild Poverty Among Girls Under 16
Immigrants | Norway
90.8
/100
|
#127
Exceptional
15.4%
Albanians
90.5
/100
|
#128
Exceptional
15.4%
Immigrants | South Eastern Asia
90.5
/100
|
#129
Exceptional
15.4%
Puget Sound Salish
90.1
/100
|
#130
Exceptional
15.4%
Immigrants | Western Europe
90.0
/100
|
#131
Exceptional
15.4%
Mongolians
89.7
/100
|
#132
Excellent
15.4%
Brazilians
89.6
/100
|
#133
Excellent
15.4%
Immigrants | Spain
89.1
/100
|
#134
Excellent
15.5%
Czechoslovakians
89.0
/100
|
#135
Excellent
15.5%
Native Hawaiians
89.0
/100
|
#136
Excellent
15.5%
South Africans
88.7
/100
|
#137
Excellent
15.5%
Immigrants | Vietnam
88.2
/100
|
#138
Excellent
15.5%
Armenians
87.9
/100
|
#139
Excellent
15.5%
New Zealanders
87.2
/100
|
#140
Excellent
15.6%
Immigrants | Jordan
87.2
/100
|
#141
Excellent
15.6%

Demographics Similar to Immigrants from South Africa by Child Poverty Among Girls Under 16

In terms of child poverty among girls under 16, the demographic groups most similar to Immigrants from South Africa are Immigrants from Malaysia (15.0%, a difference of 0.010%), Paraguayan (15.0%, a difference of 0.030%), British (15.0%, a difference of 0.030%), Immigrants from Egypt (15.0%, a difference of 0.070%), and Romanian (15.0%, a difference of 0.19%).
DemographicsRating | RankChild Poverty Among Girls Under 16
Immigrants | Switzerland
96.3
/100
|
#94
Exceptional
14.9%
Germans
96.3
/100
|
#95
Exceptional
14.9%
Immigrants | France
96.2
/100
|
#96
Exceptional
14.9%
Immigrants | Latvia
96.1
/100
|
#97
Exceptional
14.9%
Basques
95.9
/100
|
#98
Exceptional
15.0%
Immigrants | Egypt
95.7
/100
|
#99
Exceptional
15.0%
Paraguayans
95.7
/100
|
#100
Exceptional
15.0%
Immigrants | South Africa
95.6
/100
|
#101
Exceptional
15.0%
Immigrants | Malaysia
95.6
/100
|
#102
Exceptional
15.0%
British
95.6
/100
|
#103
Exceptional
15.0%
Romanians
95.3
/100
|
#104
Exceptional
15.0%
Immigrants | England
95.1
/100
|
#105
Exceptional
15.1%
Chileans
95.1
/100
|
#106
Exceptional
15.1%
Immigrants | Ukraine
95.0
/100
|
#107
Exceptional
15.1%
Immigrants | Brazil
94.9
/100
|
#108
Exceptional
15.1%