Immigrants from Spain vs Immigrants from Laos 10th Grade
COMPARE
Immigrants from Spain
Immigrants from Laos
10th Grade
10th Grade Comparison
Immigrants from Spain
Immigrants from Laos
93.8%
10TH GRADE
55.9/ 100
METRIC RATING
169th/ 347
METRIC RANK
91.9%
10TH GRADE
0.0/ 100
METRIC RATING
288th/ 347
METRIC RANK
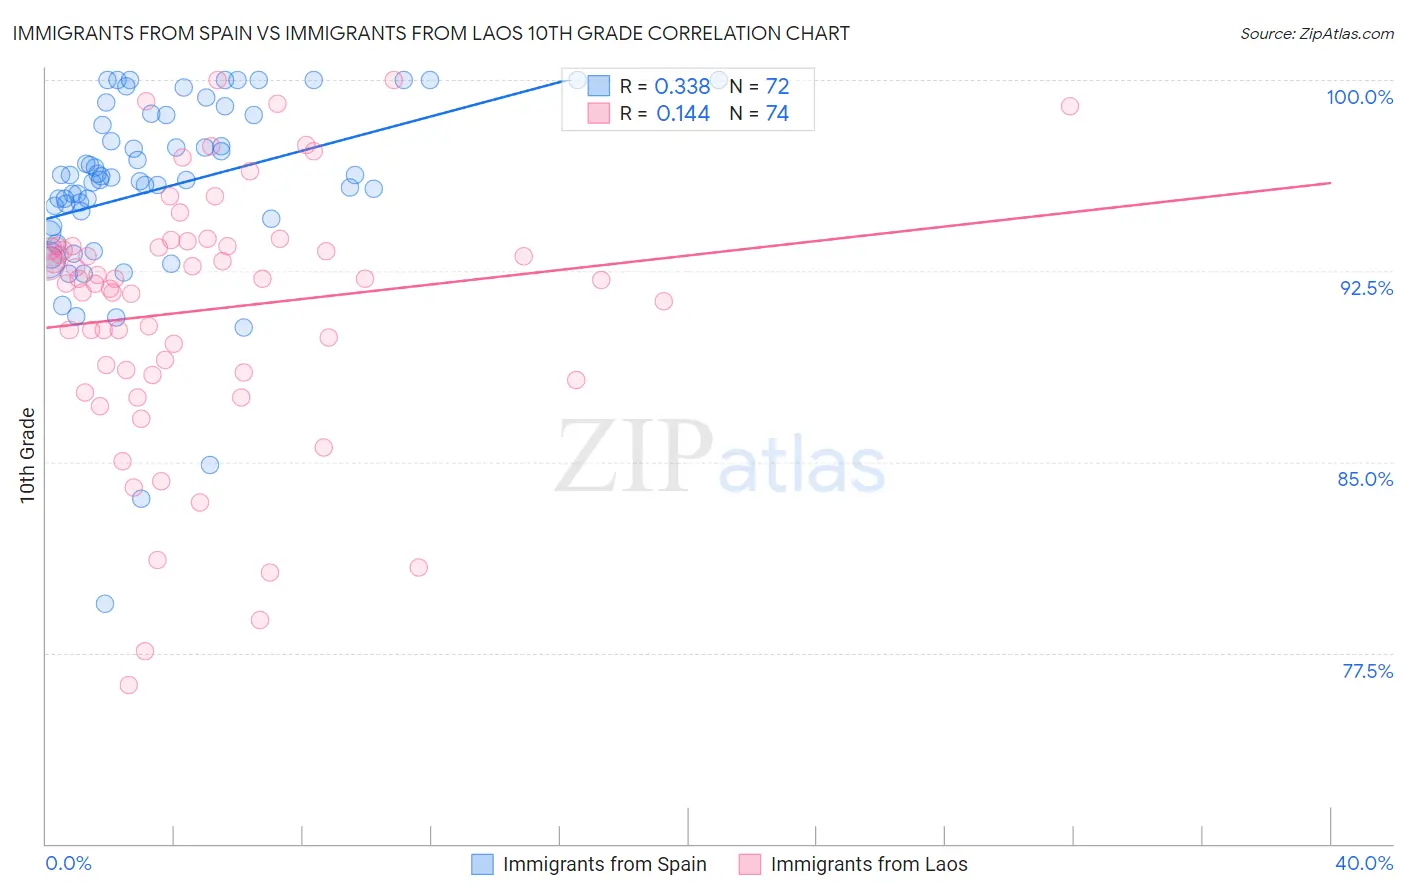
Immigrants from Spain vs Immigrants from Laos 10th Grade Correlation Chart
The statistical analysis conducted on geographies consisting of 239,682,725 people shows a mild positive correlation between the proportion of Immigrants from Spain and percentage of population with at least 10th grade education in the United States with a correlation coefficient (R) of 0.338 and weighted average of 93.8%. Similarly, the statistical analysis conducted on geographies consisting of 201,472,886 people shows a poor positive correlation between the proportion of Immigrants from Laos and percentage of population with at least 10th grade education in the United States with a correlation coefficient (R) of 0.144 and weighted average of 91.9%, a difference of 2.1%.
10th Grade Correlation Summary
| Measurement | Immigrants from Spain | Immigrants from Laos |
| Minimum | 79.4% | 76.2% |
| Maximum | 100.0% | 100.0% |
| Range | 20.6% | 23.8% |
| Mean | 95.7% | 91.0% |
| Median | 96.1% | 92.2% |
| Interquartile 25% (IQ1) | 94.4% | 88.5% |
| Interquartile 75% (IQ3) | 98.6% | 93.5% |
| Interquartile Range (IQR) | 4.2% | 5.0% |
| Standard Deviation (Sample) | 3.8% | 5.1% |
| Standard Deviation (Population) | 3.8% | 5.1% |
Similar Demographics by 10th Grade
Demographics Similar to Immigrants from Spain by 10th Grade
In terms of 10th grade, the demographic groups most similar to Immigrants from Spain are Immigrants from Venezuela (93.8%, a difference of 0.020%), Alsatian (93.8%, a difference of 0.030%), Immigrants from Albania (93.8%, a difference of 0.030%), French American Indian (93.7%, a difference of 0.050%), and Spaniard (93.7%, a difference of 0.050%).
| Demographics | Rating | Rank | 10th Grade |
| Immigrants | Poland | 69.6 /100 | #162 | Good 93.9% |
| Venezuelans | 69.5 /100 | #163 | Good 93.9% |
| Iraqis | 68.1 /100 | #164 | Good 93.9% |
| Brazilians | 63.6 /100 | #165 | Good 93.8% |
| Immigrants | Iraq | 63.0 /100 | #166 | Good 93.8% |
| Immigrants | Egypt | 62.3 /100 | #167 | Good 93.8% |
| Alsatians | 59.4 /100 | #168 | Average 93.8% |
| Immigrants | Spain | 55.9 /100 | #169 | Average 93.8% |
| Immigrants | Venezuela | 53.9 /100 | #170 | Average 93.8% |
| Immigrants | Albania | 52.4 /100 | #171 | Average 93.8% |
| French American Indians | 50.9 /100 | #172 | Average 93.7% |
| Spaniards | 50.3 /100 | #173 | Average 93.7% |
| Argentineans | 50.0 /100 | #174 | Average 93.7% |
| Immigrants | Nepal | 49.6 /100 | #175 | Average 93.7% |
| Immigrants | Argentina | 47.1 /100 | #176 | Average 93.7% |
Demographics Similar to Immigrants from Laos by 10th Grade
In terms of 10th grade, the demographic groups most similar to Immigrants from Laos are Pennsylvania German (91.9%, a difference of 0.0%), Sri Lankan (91.8%, a difference of 0.040%), British West Indian (91.8%, a difference of 0.060%), Immigrants from West Indies (91.8%, a difference of 0.060%), and Immigrants from Burma/Myanmar (91.8%, a difference of 0.070%).
| Demographics | Rating | Rank | 10th Grade |
| Bangladeshis | 0.1 /100 | #281 | Tragic 92.2% |
| Immigrants | Peru | 0.1 /100 | #282 | Tragic 92.2% |
| Immigrants | St. Vincent and the Grenadines | 0.0 /100 | #283 | Tragic 92.1% |
| Immigrants | Barbados | 0.0 /100 | #284 | Tragic 92.1% |
| Immigrants | South Eastern Asia | 0.0 /100 | #285 | Tragic 92.1% |
| Yuman | 0.0 /100 | #286 | Tragic 92.0% |
| Pennsylvania Germans | 0.0 /100 | #287 | Tragic 91.9% |
| Immigrants | Laos | 0.0 /100 | #288 | Tragic 91.9% |
| Sri Lankans | 0.0 /100 | #289 | Tragic 91.8% |
| British West Indians | 0.0 /100 | #290 | Tragic 91.8% |
| Immigrants | West Indies | 0.0 /100 | #291 | Tragic 91.8% |
| Immigrants | Burma/Myanmar | 0.0 /100 | #292 | Tragic 91.8% |
| Indonesians | 0.0 /100 | #293 | Tragic 91.8% |
| Haitians | 0.0 /100 | #294 | Tragic 91.8% |
| Lumbee | 0.0 /100 | #295 | Tragic 91.7% |