Immigrants from Scotland vs Immigrants from Croatia Receiving Food Stamps

COMPARE

Immigrants from Scotland
Race
Ancestry
AfghanAfricanAlaska NativeAlaskan AthabascanAlbanianAleutAlsatianAmericanApacheArabArapahoArgentineanArmenianAssyrian/Chaldean/SyriacAustralianAustrianBahamianBangladeshiBarbadianBasqueBelgianBelizeanBermudanBhutaneseBlackfeetBolivianBrazilianBritishBritish West IndianBulgarianBurmeseCajunCambodianCanadianCape VerdeanCarpatho RusynCelticCentral AmericanCentral American IndianCherokeeCheyenneChickasawChileanChineseChippewaChoctawColombianColvilleComancheCosta RicanCreeCreekCroatianCrowCubanCypriotCzechCzechoslovakianDanishDelawareDominicanDutchDutch West IndianEastern EuropeanEcuadorianEgyptianEnglishEstonianEthiopianEuropeanFijianFilipinoFinnishFrenchFrench American IndianFrench CanadianGermanGerman RussianGhanaianGreekGuamanian/ChamorroGuatemalanGuyaneseHaitianHmongHonduranHopiHoumaHungarianIcelanderIndian (Asian)IndonesianInupiatIranianIraqiIrishIroquoisIsraeliItalianJamaicanJapaneseJordanianKenyanKiowaKoreanLaotianLatvianLebaneseLiberianLithuanianLumbeeLuxembourgerMacedonianMalaysianMalteseMarshalleseMenomineeMexicanMexican American IndianMongolianMoroccanNative HawaiianNavajoNepaleseNew ZealanderNicaraguanNigerianNorthern EuropeanNorwegianOkinawanOsageOttawaPaiutePakistaniPalestinianPanamanianParaguayanPennsylvania GermanPeruvianPimaPolishPortuguesePotawatomiPuebloPuerto RicanPuget Sound SalishRomanianRussianSalvadoranSamoanScandinavianScotch-IrishScottishSeminoleSenegaleseSerbianShoshoneSierra LeoneanSiouxSlavicSlovakSloveneSomaliSouth AfricanSouth AmericanSouth American IndianSoviet UnionSpaniardSpanishSpanish AmericanSpanish American IndianSri LankanSubsaharan AfricanSudaneseSwedishSwissSyrianTaiwaneseThaiTlingit-HaidaTohono O'OdhamTonganTrinidadian and TobagonianTsimshianTurkishU.S. Virgin IslanderUgandanUkrainianUruguayanUteVenezuelanVietnameseWelshWest IndianYakamaYaquiYugoslavianYumanYup'ikZimbabwean
Immigration
NonimmigrantsImmigrantsAfghanistanAfricaAlbaniaArgentinaArmeniaAsiaAustraliaAustriaBahamasBangladeshBarbadosBelarusBelgiumBelizeBoliviaBosnia and HerzegovinaBrazilBulgariaBurma/MyanmarCabo VerdeCambodiaCameroonCanadaCaribbeanCentral AmericaChileChinaColombiaCongoCosta RicaCubaCzechoslovakiaDenmarkDominicaDominican RepublicEastern AfricaEastern AsiaEastern EuropeEcuadorEgyptEl SalvadorEnglandEritreaEthiopiaEuropeFijiFranceGermanyGhanaGreeceGrenadaGuatemalaGuyanaHaitiHondurasHong KongHungaryIndiaIndonesiaIranIraqIrelandIsraelItalyJamaicaJapanJordanKazakhstanKenyaKoreaKuwaitLaosLatin AmericaLatviaLebanonLiberiaLithuaniaMalaysiaMexicoMicronesiaMiddle AfricaMoldovaMoroccoNepalNetherlandsNicaraguaNigeriaNorth AmericaNorth MacedoniaNorthern AfricaNorthern EuropeNorwayOceaniaPakistanPanamaPeruPhilippinesPolandPortugalRomaniaRussiaSaudi ArabiaScotlandSenegalSerbiaSierra LeoneSingaporeSomaliaSouth AfricaSouth AmericaSouth Central AsiaSouth Eastern AsiaSouthern EuropeSpainSri LankaSt. Vincent and the GrenadinesSudanSwedenSwitzerlandSyriaTaiwanThailandTrinidad and TobagoTurkeyUgandaUkraineUruguayUzbekistanVenezuelaVietnamWest IndiesWestern AfricaWestern AsiaWestern EuropeYemenZaireZimbabweAzores
Immigrants from Croatia
Race
Ancestry
AfghanAfricanAlaska NativeAlaskan AthabascanAlbanianAleutAlsatianAmericanApacheArabArapahoArgentineanArmenianAssyrian/Chaldean/SyriacAustralianAustrianBahamianBangladeshiBarbadianBasqueBelgianBelizeanBermudanBhutaneseBlackfeetBolivianBrazilianBritishBritish West IndianBulgarianBurmeseCajunCambodianCanadianCape VerdeanCarpatho RusynCelticCentral AmericanCentral American IndianCherokeeCheyenneChickasawChileanChineseChippewaChoctawColombianColvilleComancheCosta RicanCreeCreekCroatianCrowCubanCypriotCzechCzechoslovakianDanishDelawareDominicanDutchDutch West IndianEastern EuropeanEcuadorianEgyptianEnglishEstonianEthiopianEuropeanFijianFilipinoFinnishFrenchFrench American IndianFrench CanadianGermanGerman RussianGhanaianGreekGuamanian/ChamorroGuatemalanGuyaneseHaitianHmongHonduranHopiHoumaHungarianIcelanderIndian (Asian)IndonesianInupiatIranianIraqiIrishIroquoisIsraeliItalianJamaicanJapaneseJordanianKenyanKiowaKoreanLaotianLatvianLebaneseLiberianLithuanianLumbeeLuxembourgerMacedonianMalaysianMalteseMarshalleseMenomineeMexicanMexican American IndianMongolianMoroccanNative HawaiianNavajoNepaleseNew ZealanderNicaraguanNigerianNorthern EuropeanNorwegianOkinawanOsageOttawaPaiutePakistaniPalestinianPanamanianParaguayanPennsylvania GermanPeruvianPimaPolishPortuguesePotawatomiPuebloPuerto RicanPuget Sound SalishRomanianRussianSalvadoranSamoanScandinavianScotch-IrishScottishSeminoleSenegaleseSerbianShoshoneSierra LeoneanSiouxSlavicSlovakSloveneSomaliSouth AfricanSouth AmericanSouth American IndianSoviet UnionSpaniardSpanishSpanish AmericanSpanish American IndianSri LankanSubsaharan AfricanSudaneseSwedishSwissSyrianTaiwaneseThaiTlingit-HaidaTohono O'OdhamTonganTrinidadian and TobagonianTsimshianTurkishU.S. Virgin IslanderUgandanUkrainianUruguayanUteVenezuelanVietnameseWelshWest IndianYakamaYaquiYugoslavianYumanYup'ikZimbabwean
Immigration
NonimmigrantsImmigrantsAfghanistanAfricaAlbaniaArgentinaArmeniaAsiaAustraliaAustriaBahamasBangladeshBarbadosBelarusBelgiumBelizeBoliviaBosnia and HerzegovinaBrazilBulgariaBurma/MyanmarCabo VerdeCambodiaCameroonCanadaCaribbeanCentral AmericaChileChinaColombiaCongoCosta RicaCroatiaCubaCzechoslovakiaDenmarkDominicaDominican RepublicEastern AfricaEastern AsiaEastern EuropeEcuadorEgyptEl SalvadorEnglandEritreaEthiopiaEuropeFijiFranceGermanyGhanaGreeceGrenadaGuatemalaGuyanaHaitiHondurasHong KongHungaryIndiaIndonesiaIranIraqIrelandIsraelItalyJamaicaJapanJordanKazakhstanKenyaKoreaKuwaitLaosLatin AmericaLatviaLebanonLiberiaLithuaniaMalaysiaMexicoMicronesiaMiddle AfricaMoldovaMoroccoNepalNetherlandsNicaraguaNigeriaNorth AmericaNorth MacedoniaNorthern AfricaNorthern EuropeNorwayOceaniaPakistanPanamaPeruPhilippinesPolandPortugalRomaniaRussiaSaudi ArabiaSenegalSerbiaSierra LeoneSingaporeSomaliaSouth AfricaSouth AmericaSouth Central AsiaSouth Eastern AsiaSouthern EuropeSpainSri LankaSt. Vincent and the GrenadinesSudanSwedenSwitzerlandSyriaTaiwanThailandTrinidad and TobagoTurkeyUgandaUkraineUruguayUzbekistanVenezuelaVietnamWest IndiesWestern AfricaWestern AsiaWestern EuropeYemenZaireZimbabweAzores
Receiving Food Stamps
Income
Poverty
Unemployment
Labor Participation
Family Structure
Vehicle Availability
Education Level
Disability

Receiving Food Stamps Comparison

Immigrants from Scotland

Immigrants from Croatia

Exceptional
Exceptional
9.0%
RECEIVING FOOD STAMPS
99.9/ 100
METRIC RATING
17th/ 347
METRIC RANK
10.0%
RECEIVING FOOD STAMPS
98.7/ 100
METRIC RATING
76th/ 347
METRIC RANK

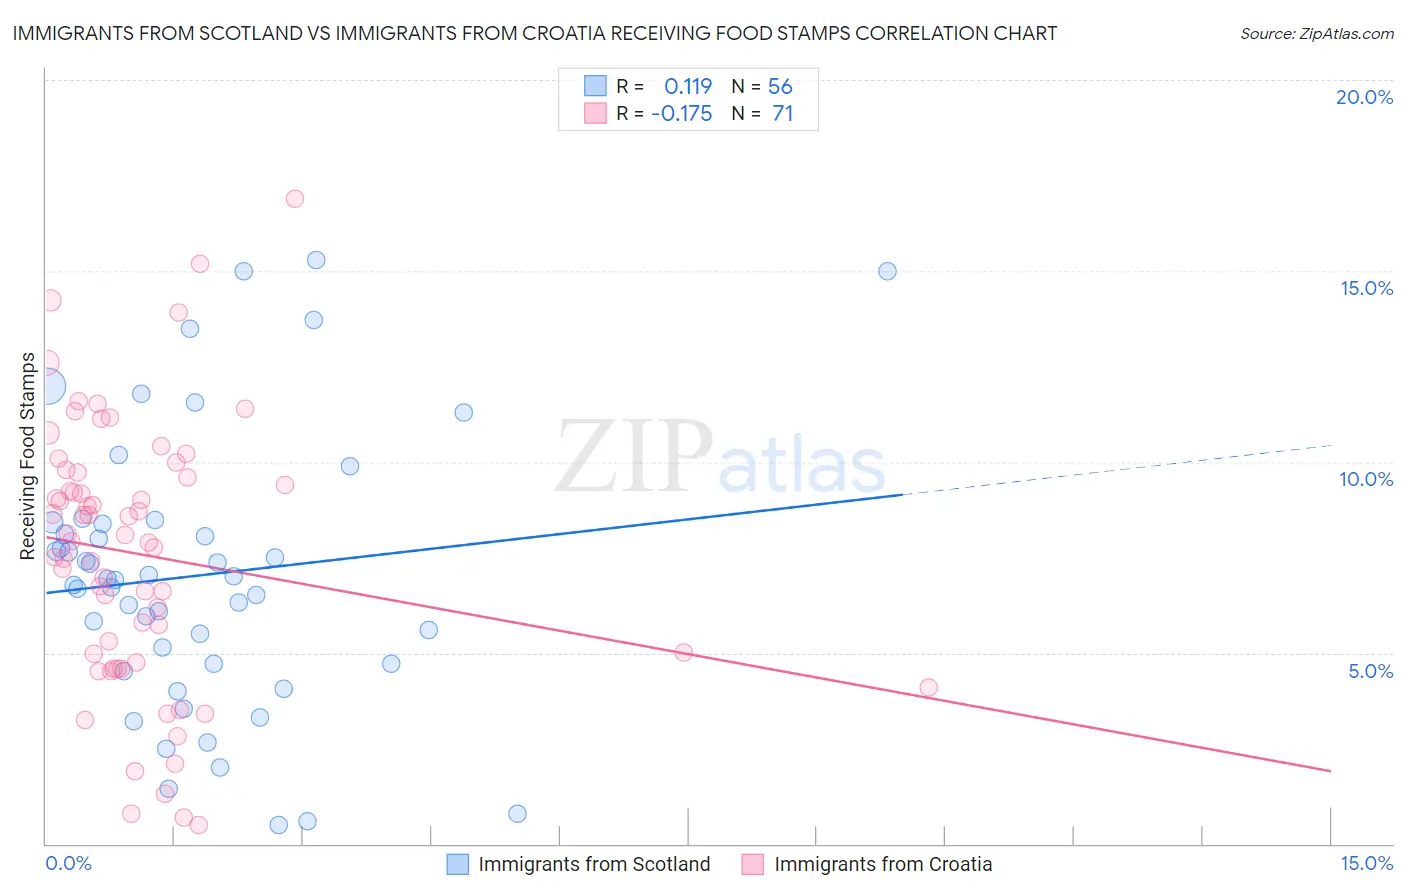
Immigrants from Scotland vs Immigrants from Croatia Receiving Food Stamps Correlation Chart

The statistical analysis conducted on geographies consisting of 196,125,913 people shows a poor positive correlation between the proportion of Immigrants from Scotland and percentage of population receiving government assistance and/or food stamps in the United States with a correlation coefficient (R) of 0.119 and weighted average of 9.0%. Similarly, the statistical analysis conducted on geographies consisting of 132,365,978 people shows a poor negative correlation between the proportion of Immigrants from Croatia and percentage of population receiving government assistance and/or food stamps in the United States with a correlation coefficient (R) of -0.175 and weighted average of 10.0%, a difference of 10.6%.
Immigrants from Scotland vs Immigrants from Croatia Receiving Food Stamps

Receiving Food Stamps Correlation Summary

MeasurementImmigrants from ScotlandImmigrants from Croatia
Minimum0.50%0.50%
Maximum15.3%16.9%
Range14.8%16.4%
Mean7.0%7.6%
Median6.9%7.9%
Interquartile 25% (IQ1)4.7%4.7%
Interquartile 75% (IQ3)8.4%9.7%
Interquartile Range (IQR)3.7%5.0%
Standard Deviation (Sample)3.6%3.5%
Standard Deviation (Population)3.6%3.5%

Similar Demographics by Receiving Food Stamps

Demographics Similar to Immigrants from Scotland by Receiving Food Stamps

In terms of receiving food stamps, the demographic groups most similar to Immigrants from Scotland are Immigrants from Japan (9.0%, a difference of 0.15%), Norwegian (9.0%, a difference of 0.43%), Danish (9.0%, a difference of 0.45%), Immigrants from Hong Kong (9.1%, a difference of 1.0%), and Maltese (8.9%, a difference of 1.1%).
DemographicsRating | RankReceiving Food Stamps
Immigrants | South Central Asia
99.9
/100
|
#10
Exceptional
8.8%
Okinawans
99.9
/100
|
#11
Exceptional
8.9%
Cypriots
99.9
/100
|
#12
Exceptional
8.9%
Bulgarians
99.9
/100
|
#13
Exceptional
8.9%
Maltese
99.9
/100
|
#14
Exceptional
8.9%
Norwegians
99.9
/100
|
#15
Exceptional
9.0%
Immigrants | Japan
99.9
/100
|
#16
Exceptional
9.0%
Immigrants | Scotland
99.9
/100
|
#17
Exceptional
9.0%
Danes
99.9
/100
|
#18
Exceptional
9.0%
Immigrants | Hong Kong
99.8
/100
|
#19
Exceptional
9.1%
Latvians
99.8
/100
|
#20
Exceptional
9.1%
Luxembourgers
99.8
/100
|
#21
Exceptional
9.1%
Immigrants | Australia
99.8
/100
|
#22
Exceptional
9.2%
Eastern Europeans
99.8
/100
|
#23
Exceptional
9.2%
Immigrants | Northern Europe
99.8
/100
|
#24
Exceptional
9.2%

Demographics Similar to Immigrants from Croatia by Receiving Food Stamps

In terms of receiving food stamps, the demographic groups most similar to Immigrants from Croatia are Immigrants from Zimbabwe (9.9%, a difference of 0.010%), Immigrants from North Macedonia (10.0%, a difference of 0.080%), South African (10.0%, a difference of 0.13%), Laotian (10.0%, a difference of 0.17%), and Polish (10.0%, a difference of 0.25%).
DemographicsRating | RankReceiving Food Stamps
Italians
99.0
/100
|
#69
Exceptional
9.9%
Immigrants | Serbia
99.0
/100
|
#70
Exceptional
9.9%
Scottish
98.9
/100
|
#71
Exceptional
9.9%
Immigrants | Asia
98.9
/100
|
#72
Exceptional
9.9%
Macedonians
98.9
/100
|
#73
Exceptional
9.9%
New Zealanders
98.8
/100
|
#74
Exceptional
9.9%
Immigrants | Zimbabwe
98.7
/100
|
#75
Exceptional
9.9%
Immigrants | Croatia
98.7
/100
|
#76
Exceptional
10.0%
Immigrants | North Macedonia
98.7
/100
|
#77
Exceptional
10.0%
South Africans
98.7
/100
|
#78
Exceptional
10.0%
Laotians
98.7
/100
|
#79
Exceptional
10.0%
Poles
98.6
/100
|
#80
Exceptional
10.0%
Immigrants | England
98.6
/100
|
#81
Exceptional
10.0%
Austrians
98.6
/100
|
#82
Exceptional
10.0%
Dutch
98.6
/100
|
#83
Exceptional
10.0%