Immigrants from Guatemala vs Immigrants from Chile Receiving Food Stamps

COMPARE

Immigrants from Guatemala
Race
Ancestry
AfghanAfricanAlaska NativeAlaskan AthabascanAlbanianAleutAlsatianAmericanApacheArabArapahoArgentineanArmenianAssyrian/Chaldean/SyriacAustralianAustrianBahamianBangladeshiBarbadianBasqueBelgianBelizeanBermudanBhutaneseBlackfeetBolivianBrazilianBritishBritish West IndianBulgarianBurmeseCajunCambodianCanadianCape VerdeanCarpatho RusynCelticCentral AmericanCentral American IndianCherokeeCheyenneChickasawChileanChineseChippewaChoctawColombianColvilleComancheCosta RicanCreeCreekCroatianCrowCubanCypriotCzechCzechoslovakianDanishDelawareDominicanDutchDutch West IndianEastern EuropeanEcuadorianEgyptianEnglishEstonianEthiopianEuropeanFijianFilipinoFinnishFrenchFrench American IndianFrench CanadianGermanGerman RussianGhanaianGreekGuamanian/ChamorroGuatemalanGuyaneseHaitianHmongHonduranHopiHoumaHungarianIcelanderIndian (Asian)IndonesianInupiatIranianIraqiIrishIroquoisIsraeliItalianJamaicanJapaneseJordanianKenyanKiowaKoreanLaotianLatvianLebaneseLiberianLithuanianLumbeeLuxembourgerMacedonianMalaysianMalteseMarshalleseMenomineeMexicanMexican American IndianMongolianMoroccanNative HawaiianNavajoNepaleseNew ZealanderNicaraguanNigerianNorthern EuropeanNorwegianOkinawanOsageOttawaPaiutePakistaniPalestinianPanamanianParaguayanPennsylvania GermanPeruvianPimaPolishPortuguesePotawatomiPuebloPuerto RicanPuget Sound SalishRomanianRussianSalvadoranSamoanScandinavianScotch-IrishScottishSeminoleSenegaleseSerbianShoshoneSierra LeoneanSiouxSlavicSlovakSloveneSomaliSouth AfricanSouth AmericanSouth American IndianSoviet UnionSpaniardSpanishSpanish AmericanSpanish American IndianSri LankanSubsaharan AfricanSudaneseSwedishSwissSyrianTaiwaneseThaiTlingit-HaidaTohono O'OdhamTonganTrinidadian and TobagonianTsimshianTurkishU.S. Virgin IslanderUgandanUkrainianUruguayanUteVenezuelanVietnameseWelshWest IndianYakamaYaquiYugoslavianYumanYup'ikZimbabwean
Immigration
NonimmigrantsImmigrantsAfghanistanAfricaAlbaniaArgentinaArmeniaAsiaAustraliaAustriaBahamasBangladeshBarbadosBelarusBelgiumBelizeBoliviaBosnia and HerzegovinaBrazilBulgariaBurma/MyanmarCabo VerdeCambodiaCameroonCanadaCaribbeanCentral AmericaChinaColombiaCongoCosta RicaCroatiaCubaCzechoslovakiaDenmarkDominicaDominican RepublicEastern AfricaEastern AsiaEastern EuropeEcuadorEgyptEl SalvadorEnglandEritreaEthiopiaEuropeFijiFranceGermanyGhanaGreeceGrenadaGuatemalaGuyanaHaitiHondurasHong KongHungaryIndiaIndonesiaIranIraqIrelandIsraelItalyJamaicaJapanJordanKazakhstanKenyaKoreaKuwaitLaosLatin AmericaLatviaLebanonLiberiaLithuaniaMalaysiaMexicoMicronesiaMiddle AfricaMoldovaMoroccoNepalNetherlandsNicaraguaNigeriaNorth AmericaNorth MacedoniaNorthern AfricaNorthern EuropeNorwayOceaniaPakistanPanamaPeruPhilippinesPolandPortugalRomaniaRussiaSaudi ArabiaScotlandSenegalSerbiaSierra LeoneSingaporeSomaliaSouth AfricaSouth AmericaSouth Central AsiaSouth Eastern AsiaSouthern EuropeSpainSri LankaSt. Vincent and the GrenadinesSudanSwedenSwitzerlandSyriaTaiwanThailandTrinidad and TobagoTurkeyUgandaUkraineUruguayUzbekistanVenezuelaVietnamWest IndiesWestern AfricaWestern AsiaWestern EuropeYemenZaireZimbabweAzores
Immigrants from Chile
Race
Ancestry
AfghanAfricanAlaska NativeAlaskan AthabascanAlbanianAleutAlsatianAmericanApacheArabArapahoArgentineanArmenianAssyrian/Chaldean/SyriacAustralianAustrianBahamianBangladeshiBarbadianBasqueBelgianBelizeanBermudanBhutaneseBlackfeetBolivianBrazilianBritishBritish West IndianBulgarianBurmeseCajunCambodianCanadianCape VerdeanCarpatho RusynCelticCentral AmericanCentral American IndianCherokeeCheyenneChickasawChileanChineseChippewaChoctawColombianColvilleComancheCosta RicanCreeCreekCroatianCrowCubanCypriotCzechCzechoslovakianDanishDelawareDominicanDutchDutch West IndianEastern EuropeanEcuadorianEgyptianEnglishEstonianEthiopianEuropeanFijianFilipinoFinnishFrenchFrench American IndianFrench CanadianGermanGerman RussianGhanaianGreekGuamanian/ChamorroGuatemalanGuyaneseHaitianHmongHonduranHopiHoumaHungarianIcelanderIndian (Asian)IndonesianInupiatIranianIraqiIrishIroquoisIsraeliItalianJamaicanJapaneseJordanianKenyanKiowaKoreanLaotianLatvianLebaneseLiberianLithuanianLumbeeLuxembourgerMacedonianMalaysianMalteseMarshalleseMenomineeMexicanMexican American IndianMongolianMoroccanNative HawaiianNavajoNepaleseNew ZealanderNicaraguanNigerianNorthern EuropeanNorwegianOkinawanOsageOttawaPaiutePakistaniPalestinianPanamanianParaguayanPennsylvania GermanPeruvianPimaPolishPortuguesePotawatomiPuebloPuerto RicanPuget Sound SalishRomanianRussianSalvadoranSamoanScandinavianScotch-IrishScottishSeminoleSenegaleseSerbianShoshoneSierra LeoneanSiouxSlavicSlovakSloveneSomaliSouth AfricanSouth AmericanSouth American IndianSoviet UnionSpaniardSpanishSpanish AmericanSpanish American IndianSri LankanSubsaharan AfricanSudaneseSwedishSwissSyrianTaiwaneseThaiTlingit-HaidaTohono O'OdhamTonganTrinidadian and TobagonianTsimshianTurkishU.S. Virgin IslanderUgandanUkrainianUruguayanUteVenezuelanVietnameseWelshWest IndianYakamaYaquiYugoslavianYumanYup'ikZimbabwean
Immigration
NonimmigrantsImmigrantsAfghanistanAfricaAlbaniaArgentinaArmeniaAsiaAustraliaAustriaBahamasBangladeshBarbadosBelarusBelgiumBelizeBoliviaBosnia and HerzegovinaBrazilBulgariaBurma/MyanmarCabo VerdeCambodiaCameroonCanadaCaribbeanCentral AmericaChileChinaColombiaCongoCosta RicaCroatiaCubaCzechoslovakiaDenmarkDominicaDominican RepublicEastern AfricaEastern AsiaEastern EuropeEcuadorEgyptEl SalvadorEnglandEritreaEthiopiaEuropeFijiFranceGermanyGhanaGreeceGrenadaGuyanaHaitiHondurasHong KongHungaryIndiaIndonesiaIranIraqIrelandIsraelItalyJamaicaJapanJordanKazakhstanKenyaKoreaKuwaitLaosLatin AmericaLatviaLebanonLiberiaLithuaniaMalaysiaMexicoMicronesiaMiddle AfricaMoldovaMoroccoNepalNetherlandsNicaraguaNigeriaNorth AmericaNorth MacedoniaNorthern AfricaNorthern EuropeNorwayOceaniaPakistanPanamaPeruPhilippinesPolandPortugalRomaniaRussiaSaudi ArabiaScotlandSenegalSerbiaSierra LeoneSingaporeSomaliaSouth AfricaSouth AmericaSouth Central AsiaSouth Eastern AsiaSouthern EuropeSpainSri LankaSt. Vincent and the GrenadinesSudanSwedenSwitzerlandSyriaTaiwanThailandTrinidad and TobagoTurkeyUgandaUkraineUruguayUzbekistanVenezuelaVietnamWest IndiesWestern AfricaWestern AsiaWestern EuropeYemenZaireZimbabweAzores
Receiving Food Stamps
Income
Poverty
Unemployment
Labor Participation
Family Structure
Vehicle Availability
Education Level
Disability

Receiving Food Stamps Comparison

Immigrants from Guatemala

Immigrants from Chile

Tragic
Good
14.6%
RECEIVING FOOD STAMPS
0.1/ 100
METRIC RATING
271st/ 347
METRIC RANK
11.5%
RECEIVING FOOD STAMPS
65.0/ 100
METRIC RATING
164th/ 347
METRIC RANK

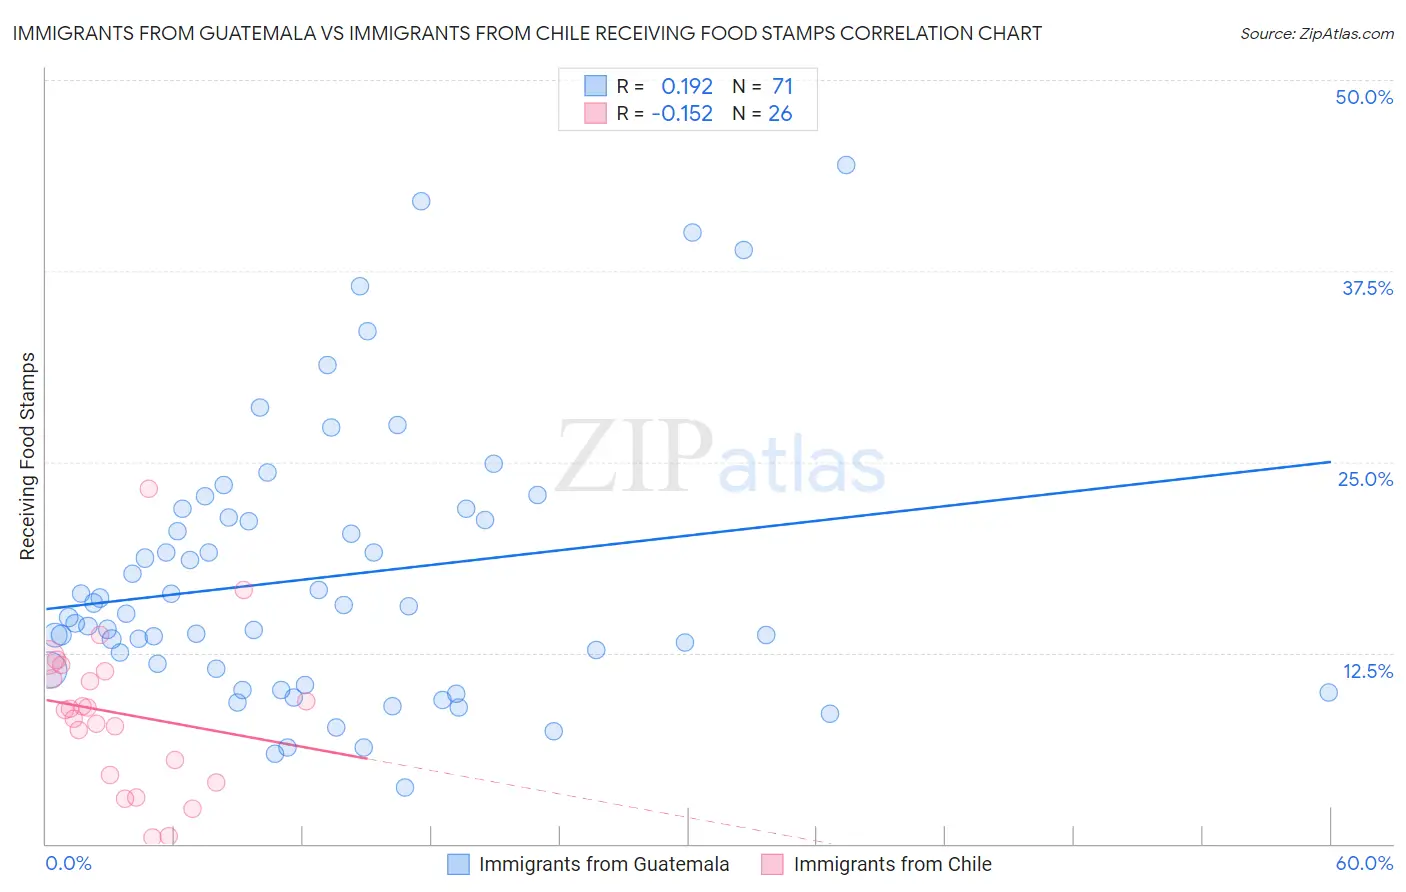
Immigrants from Guatemala vs Immigrants from Chile Receiving Food Stamps Correlation Chart

The statistical analysis conducted on geographies consisting of 376,736,274 people shows a poor positive correlation between the proportion of Immigrants from Guatemala and percentage of population receiving government assistance and/or food stamps in the United States with a correlation coefficient (R) of 0.192 and weighted average of 14.6%. Similarly, the statistical analysis conducted on geographies consisting of 218,329,449 people shows a poor negative correlation between the proportion of Immigrants from Chile and percentage of population receiving government assistance and/or food stamps in the United States with a correlation coefficient (R) of -0.152 and weighted average of 11.5%, a difference of 27.6%.
Immigrants from Guatemala vs Immigrants from Chile Receiving Food Stamps

Receiving Food Stamps Correlation Summary

MeasurementImmigrants from GuatemalaImmigrants from Chile
Minimum3.7%0.40%
Maximum44.4%23.2%
Range40.7%22.8%
Mean17.4%8.5%
Median15.1%8.8%
Interquartile 25% (IQ1)11.4%4.5%
Interquartile 75% (IQ3)21.3%11.3%
Interquartile Range (IQR)10.0%6.8%
Standard Deviation (Sample)8.9%5.1%
Standard Deviation (Population)8.8%5.0%

Similar Demographics by Receiving Food Stamps

Demographics Similar to Immigrants from Guatemala by Receiving Food Stamps

In terms of receiving food stamps, the demographic groups most similar to Immigrants from Guatemala are Mexican (14.6%, a difference of 0.090%), Chippewa (14.7%, a difference of 0.22%), Alaskan Athabascan (14.7%, a difference of 0.25%), Immigrants from Western Africa (14.7%, a difference of 0.27%), and Nepalese (14.6%, a difference of 0.30%).
DemographicsRating | RankReceiving Food Stamps
Immigrants | Uzbekistan
0.2
/100
|
#264
Tragic
14.3%
Blackfeet
0.2
/100
|
#265
Tragic
14.3%
Cheyenne
0.2
/100
|
#266
Tragic
14.3%
Dutch West Indians
0.2
/100
|
#267
Tragic
14.3%
Guatemalans
0.1
/100
|
#268
Tragic
14.4%
Nepalese
0.1
/100
|
#269
Tragic
14.6%
Mexicans
0.1
/100
|
#270
Tragic
14.6%
Immigrants | Guatemala
0.1
/100
|
#271
Tragic
14.6%
Chippewa
0.1
/100
|
#272
Tragic
14.7%
Alaskan Athabascans
0.1
/100
|
#273
Tragic
14.7%
Immigrants | Western Africa
0.1
/100
|
#274
Tragic
14.7%
Ute
0.1
/100
|
#275
Tragic
14.7%
Liberians
0.1
/100
|
#276
Tragic
14.8%
Seminole
0.1
/100
|
#277
Tragic
14.8%
Belizeans
0.1
/100
|
#278
Tragic
14.8%

Demographics Similar to Immigrants from Chile by Receiving Food Stamps

In terms of receiving food stamps, the demographic groups most similar to Immigrants from Chile are Arab (11.5%, a difference of 0.050%), Immigrants from Southern Europe (11.5%, a difference of 0.12%), Immigrants from Belarus (11.5%, a difference of 0.35%), Alsatian (11.4%, a difference of 0.48%), and Pennsylvania German (11.4%, a difference of 0.55%).
DemographicsRating | RankReceiving Food Stamps
Immigrants | Lebanon
75.2
/100
|
#157
Good
11.3%
Immigrants | Bosnia and Herzegovina
72.6
/100
|
#158
Good
11.3%
Immigrants | Oceania
70.4
/100
|
#159
Good
11.4%
French Canadians
69.5
/100
|
#160
Good
11.4%
Pennsylvania Germans
68.4
/100
|
#161
Good
11.4%
Alsatians
68.0
/100
|
#162
Good
11.4%
Immigrants | Southern Europe
65.8
/100
|
#163
Good
11.5%
Immigrants | Chile
65.0
/100
|
#164
Good
11.5%
Arabs
64.7
/100
|
#165
Good
11.5%
Immigrants | Belarus
62.8
/100
|
#166
Good
11.5%
Kenyans
60.2
/100
|
#167
Good
11.6%
Tlingit-Haida
59.1
/100
|
#168
Average
11.6%
Immigrants | Eastern Africa
58.3
/100
|
#169
Average
11.6%
Costa Ricans
57.9
/100
|
#170
Average
11.6%
Immigrants | Western Asia
56.4
/100
|
#171
Average
11.6%