Immigrants from Ghana vs Greek Receiving Food Stamps
COMPARE
Immigrants from Ghana
Greek
Receiving Food Stamps
Receiving Food Stamps Comparison
Immigrants from Ghana
Greeks
14.1%
RECEIVING FOOD STAMPS
0.3/ 100
METRIC RATING
258th/ 347
METRIC RANK
9.7%
RECEIVING FOOD STAMPS
99.3/ 100
METRIC RATING
57th/ 347
METRIC RANK
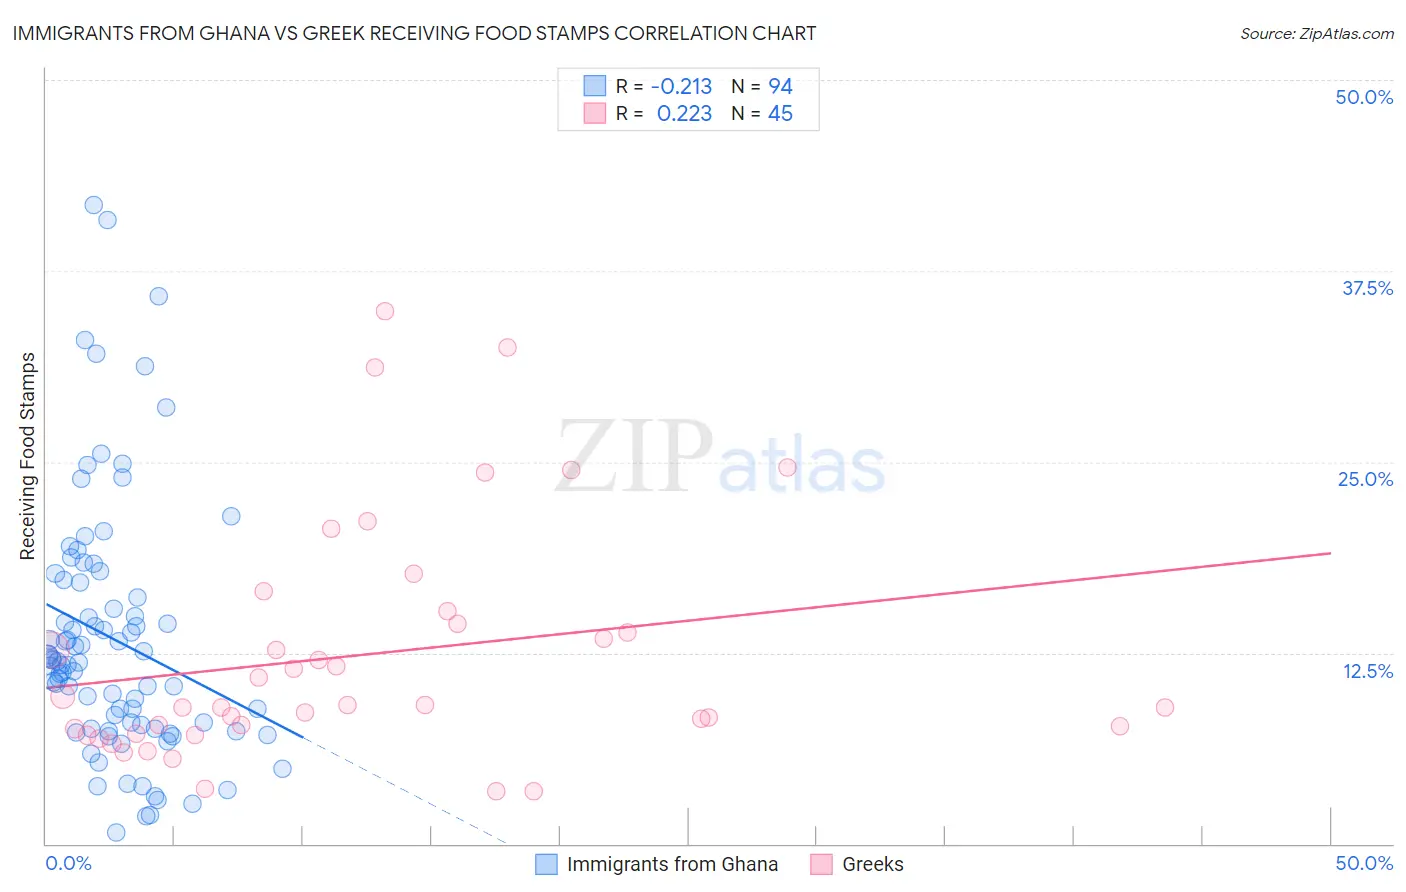
Immigrants from Ghana vs Greek Receiving Food Stamps Correlation Chart
The statistical analysis conducted on geographies consisting of 199,399,375 people shows a weak negative correlation between the proportion of Immigrants from Ghana and percentage of population receiving government assistance and/or food stamps in the United States with a correlation coefficient (R) of -0.213 and weighted average of 14.1%. Similarly, the statistical analysis conducted on geographies consisting of 480,606,207 people shows a weak positive correlation between the proportion of Greeks and percentage of population receiving government assistance and/or food stamps in the United States with a correlation coefficient (R) of 0.223 and weighted average of 9.7%, a difference of 45.1%.
Receiving Food Stamps Correlation Summary
| Measurement | Immigrants from Ghana | Greek |
| Minimum | 0.70% | 3.4% |
| Maximum | 41.8% | 34.9% |
| Range | 41.1% | 31.5% |
| Mean | 13.4% | 12.4% |
| Median | 11.9% | 9.0% |
| Interquartile 25% (IQ1) | 7.5% | 7.4% |
| Interquartile 75% (IQ3) | 17.1% | 14.8% |
| Interquartile Range (IQR) | 9.6% | 7.4% |
| Standard Deviation (Sample) | 8.3% | 7.7% |
| Standard Deviation (Population) | 8.3% | 7.7% |
Similar Demographics by Receiving Food Stamps
Demographics Similar to Immigrants from Ghana by Receiving Food Stamps
In terms of receiving food stamps, the demographic groups most similar to Immigrants from Ghana are Arapaho (14.1%, a difference of 0.080%), Creek (14.1%, a difference of 0.12%), Japanese (14.1%, a difference of 0.18%), Subsaharan African (14.1%, a difference of 0.20%), and Marshallese (14.1%, a difference of 0.21%).
| Demographics | Rating | Rank | Receiving Food Stamps |
| Yaqui | 0.5 /100 | #251 | Tragic 13.9% |
| Ghanaians | 0.5 /100 | #252 | Tragic 14.0% |
| Spanish Americans | 0.4 /100 | #253 | Tragic 14.0% |
| Marshallese | 0.3 /100 | #254 | Tragic 14.1% |
| Sub-Saharan Africans | 0.3 /100 | #255 | Tragic 14.1% |
| Japanese | 0.3 /100 | #256 | Tragic 14.1% |
| Arapaho | 0.3 /100 | #257 | Tragic 14.1% |
| Immigrants | Ghana | 0.3 /100 | #258 | Tragic 14.1% |
| Creek | 0.3 /100 | #259 | Tragic 14.1% |
| Central Americans | 0.3 /100 | #260 | Tragic 14.1% |
| Immigrants | Congo | 0.3 /100 | #261 | Tragic 14.1% |
| Paiute | 0.2 /100 | #262 | Tragic 14.3% |
| Immigrants | Portugal | 0.2 /100 | #263 | Tragic 14.3% |
| Immigrants | Uzbekistan | 0.2 /100 | #264 | Tragic 14.3% |
| Blackfeet | 0.2 /100 | #265 | Tragic 14.3% |
Demographics Similar to Greeks by Receiving Food Stamps
In terms of receiving food stamps, the demographic groups most similar to Greeks are Scandinavian (9.7%, a difference of 0.060%), British (9.7%, a difference of 0.090%), Immigrants from Canada (9.7%, a difference of 0.11%), German (9.7%, a difference of 0.19%), and Immigrants from Switzerland (9.7%, a difference of 0.29%).
| Demographics | Rating | Rank | Receiving Food Stamps |
| Lithuanians | 99.4 /100 | #50 | Exceptional 9.7% |
| Asians | 99.3 /100 | #51 | Exceptional 9.7% |
| Immigrants | South Africa | 99.3 /100 | #52 | Exceptional 9.7% |
| Tongans | 99.3 /100 | #53 | Exceptional 9.7% |
| Swiss | 99.3 /100 | #54 | Exceptional 9.7% |
| Immigrants | Switzerland | 99.3 /100 | #55 | Exceptional 9.7% |
| Immigrants | Canada | 99.3 /100 | #56 | Exceptional 9.7% |
| Greeks | 99.3 /100 | #57 | Exceptional 9.7% |
| Scandinavians | 99.2 /100 | #58 | Exceptional 9.7% |
| British | 99.2 /100 | #59 | Exceptional 9.7% |
| Germans | 99.2 /100 | #60 | Exceptional 9.7% |
| English | 99.2 /100 | #61 | Exceptional 9.8% |
| Immigrants | Bulgaria | 99.2 /100 | #62 | Exceptional 9.8% |
| Chinese | 99.2 /100 | #63 | Exceptional 9.8% |
| Immigrants | North America | 99.2 /100 | #64 | Exceptional 9.8% |