Zip Codes with the Highest Percentage of Population Employed in Administrative & Support Services in West Chester, PA
RELATED REPORTS & OPTIONS
Administrative & Support Services
West Chester
Compare Zip Codes
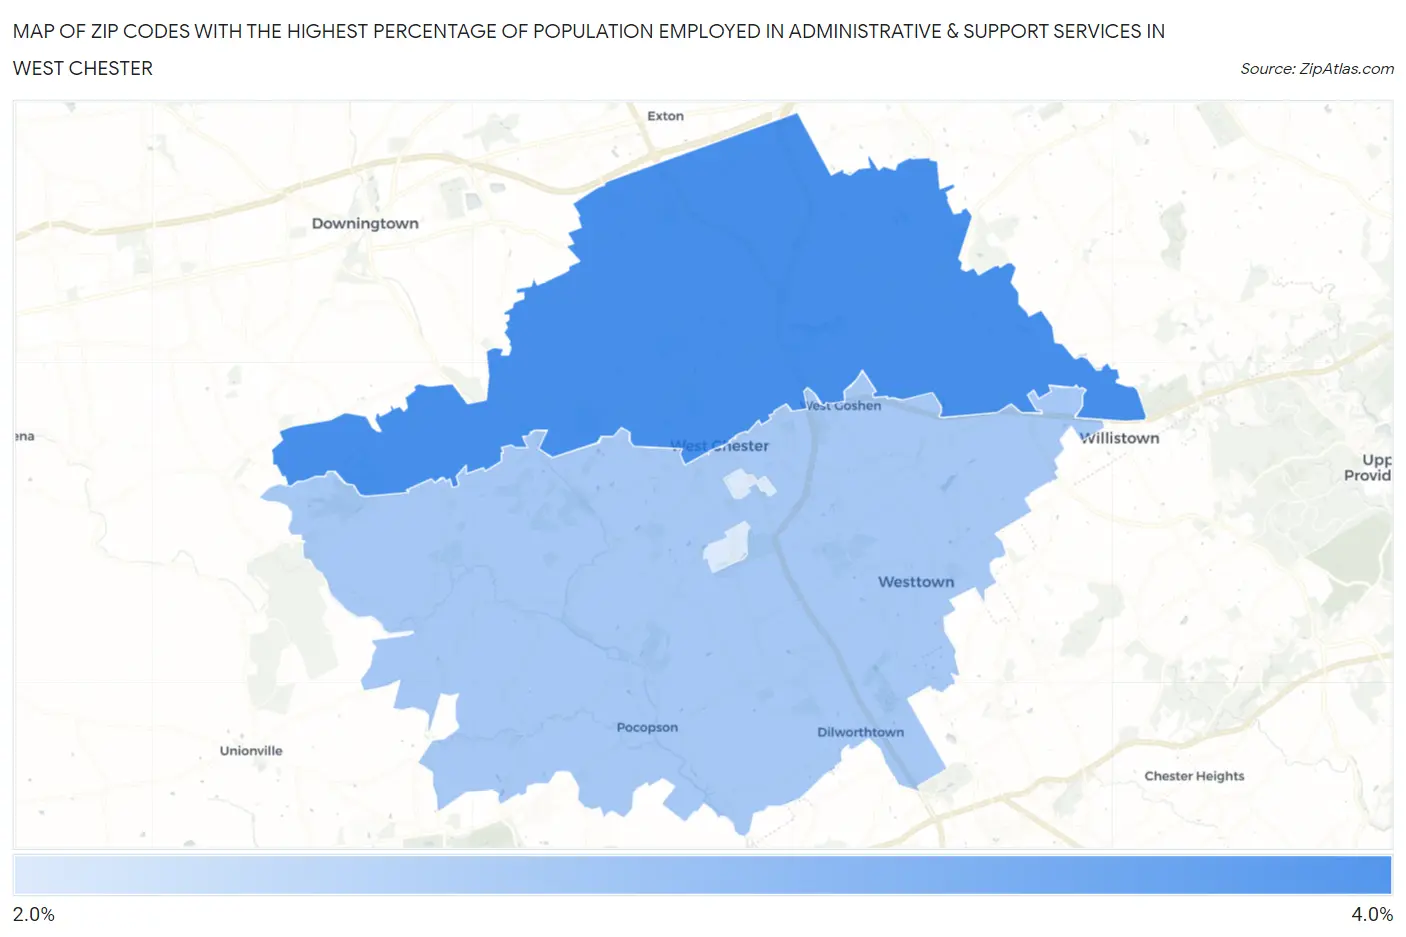
Map of Zip Codes with the Highest Percentage of Population Employed in Administrative & Support Services in West Chester
0.0%
4.0%
Zip Codes with the Highest Percentage of Population Employed in Administrative & Support Services in West Chester, PA
| Zip Code | % Employed | vs State | vs National | |
| 1. | 19380 | 3.0% | 3.6%(-0.564)#790 | 4.1%(-1.13)#15,364 |
| 2. | 19382 | 2.9% | 3.6%(-0.694)#839 | 4.1%(-1.26)#16,042 |
| 3. | 19383 | 2.8% | 3.6%(-0.768)#871 | 4.1%(-1.33)#16,446 |
1
Common Questions
What are the Top Zip Codes with the Highest Percentage of Population Employed in Administrative & Support Services in West Chester, PA?
Top Zip Codes with the Highest Percentage of Population Employed in Administrative & Support Services in West Chester, PA are:
What zip code has the Highest Percentage of Population Employed in Administrative & Support Services in West Chester, PA?
19380 has the Highest Percentage of Population Employed in Administrative & Support Services in West Chester, PA with 3.0%.
What is the Percentage of Population Employed in Administrative & Support Services in Pennsylvania?
Percentage of Population Employed in Administrative & Support Services in Pennsylvania is 3.6%.
What is the Percentage of Population Employed in Administrative & Support Services in the United States?
Percentage of Population Employed in Administrative & Support Services in the United States is 4.1%.