Zip Codes with the Highest Percentage of Population Employed in Office & Administration in Scranton, PA
RELATED REPORTS & OPTIONS
Office & Administration
Scranton
Compare Zip Codes
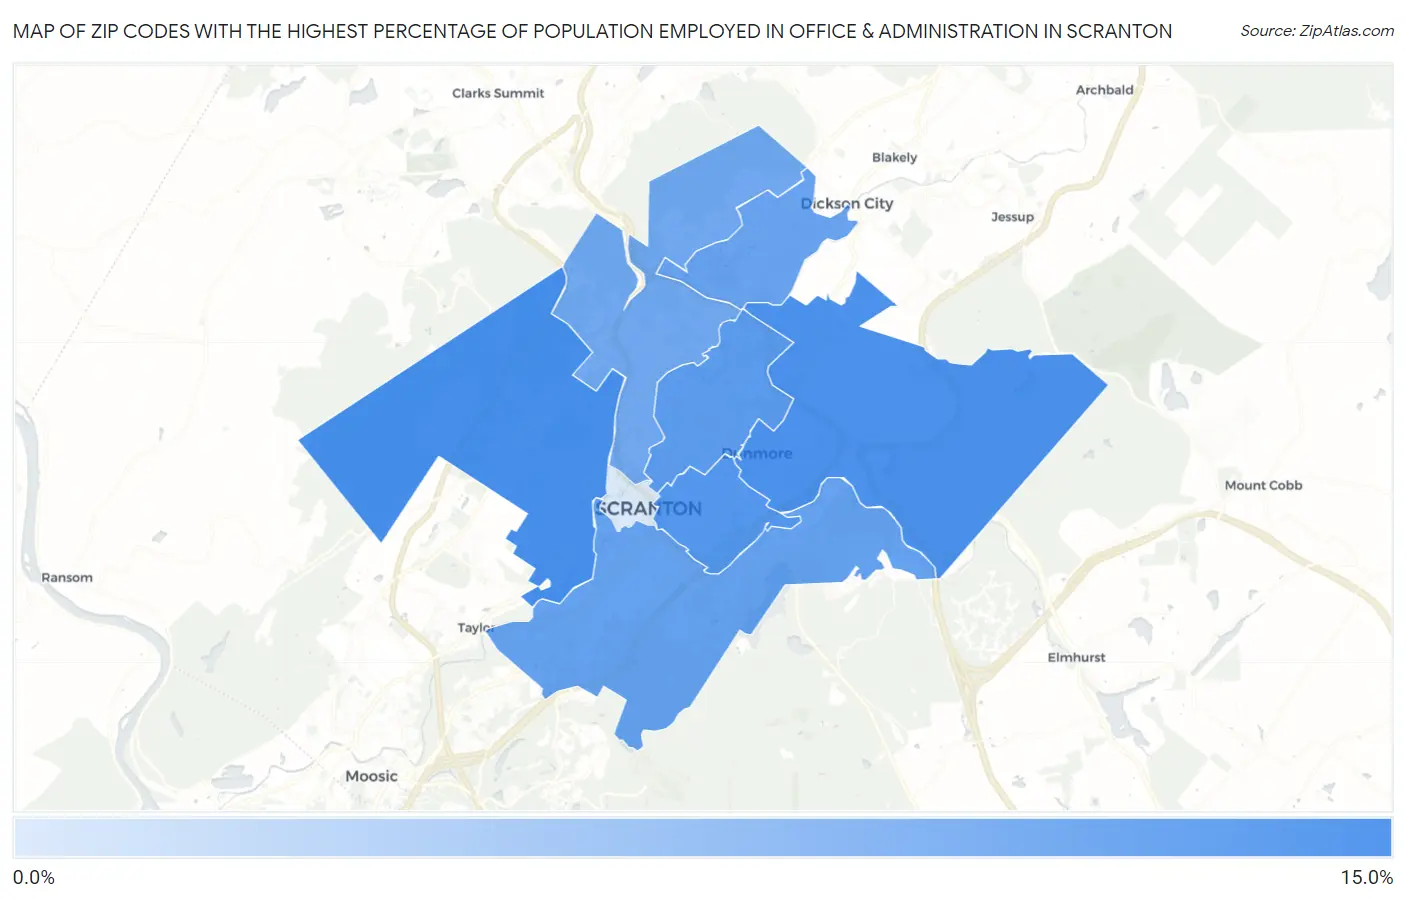
Map of Zip Codes with the Highest Percentage of Population Employed in Office & Administration in Scranton
0.0%
15.0%
Zip Codes with the Highest Percentage of Population Employed in Office & Administration in Scranton, PA
| Zip Code | % Employed | vs State | vs National | |
| 1. | 18504 | 12.9% | 10.9%(+2.00)#490 | 10.9%(+2.04)#8,332 |
| 2. | 18512 | 12.5% | 10.9%(+1.63)#540 | 10.9%(+1.67)#9,216 |
| 3. | 18510 | 11.8% | 10.9%(+0.928)#670 | 10.9%(+0.960)#11,300 |
| 4. | 18509 | 11.5% | 10.9%(+0.641)#722 | 10.9%(+0.673)#12,180 |
| 5. | 18505 | 10.6% | 10.9%(-0.258)#887 | 10.9%(-0.227)#15,036 |
| 6. | 18519 | 10.6% | 10.9%(-0.318)#903 | 10.9%(-0.287)#15,237 |
| 7. | 18508 | 9.9% | 10.9%(-0.996)#1,025 | 10.9%(-0.965)#17,488 |
| 8. | 18503 | 2.2% | 10.9%(-8.68)#1,651 | 10.9%(-8.65)#30,016 |
1
Common Questions
What are the Top 5 Zip Codes with the Highest Percentage of Population Employed in Office & Administration in Scranton, PA?
Top 5 Zip Codes with the Highest Percentage of Population Employed in Office & Administration in Scranton, PA are:
What zip code has the Highest Percentage of Population Employed in Office & Administration in Scranton, PA?
18504 has the Highest Percentage of Population Employed in Office & Administration in Scranton, PA with 12.9%.
What is the Percentage of Population Employed in Office & Administration in Scranton, PA?
Percentage of Population Employed in Office & Administration in Scranton is 11.1%.
What is the Percentage of Population Employed in Office & Administration in Pennsylvania?
Percentage of Population Employed in Office & Administration in Pennsylvania is 10.9%.
What is the Percentage of Population Employed in Office & Administration in the United States?
Percentage of Population Employed in Office & Administration in the United States is 10.9%.