Zip Codes with the Highest Percentage of Families with Income Above $200,000 in Lebanon, PA
RELATED REPORTS & OPTIONS
Family Income | $200k+
Lebanon
Compare Zip Codes
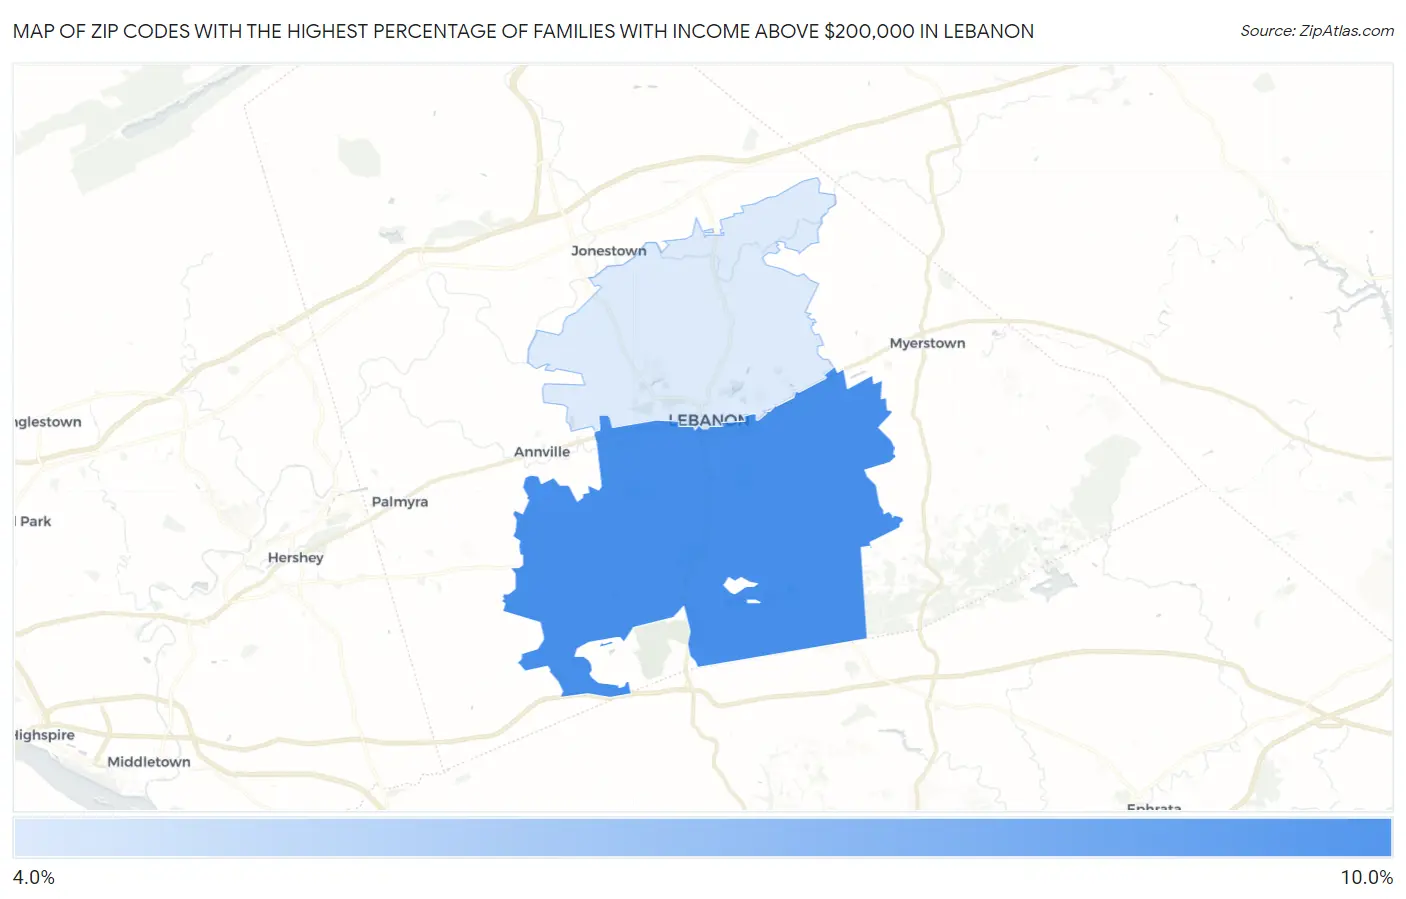
Map of Zip Codes with the Highest Percentage of Families with Income Above $200,000 in Lebanon
0.0%
10.0%
Zip Codes with the Highest Percentage of Families with Income Above $200,000 in Lebanon, PA
| Zip Code | Families with Income > $200k | vs State | vs National | |
| 1. | 17042 | 8.8% | 14.0%(-5.20)#588 | 14.8%(-6.00)#12,137 |
| 2. | 17046 | 4.9% | 14.0%(-9.10)#949 | 14.8%(-9.90)#18,605 |
1
Common Questions
What are the Top Zip Codes with the Highest Percentage of Families with Income Above $200,000 in Lebanon, PA?
Top Zip Codes with the Highest Percentage of Families with Income Above $200,000 in Lebanon, PA are:
What zip code has the Highest Percentage of Families with Income Above $200,000 in Lebanon, PA?
17042 has the Highest Percentage of Families with Income Above $200,000 in Lebanon, PA with 8.8%.
What is the Percentage of Families with Income Above $200,000 in Lebanon, PA?
Percentage of Families with Income Above $200,000 in Lebanon is 2.5%.
What is the Percentage of Families with Income Above $200,000 in Pennsylvania?
Percentage of Families with Income Above $200,000 in Pennsylvania is 14.0%.
What is the Percentage of Families with Income Above $200,000 in the United States?
Percentage of Families with Income Above $200,000 in the United States is 14.8%.