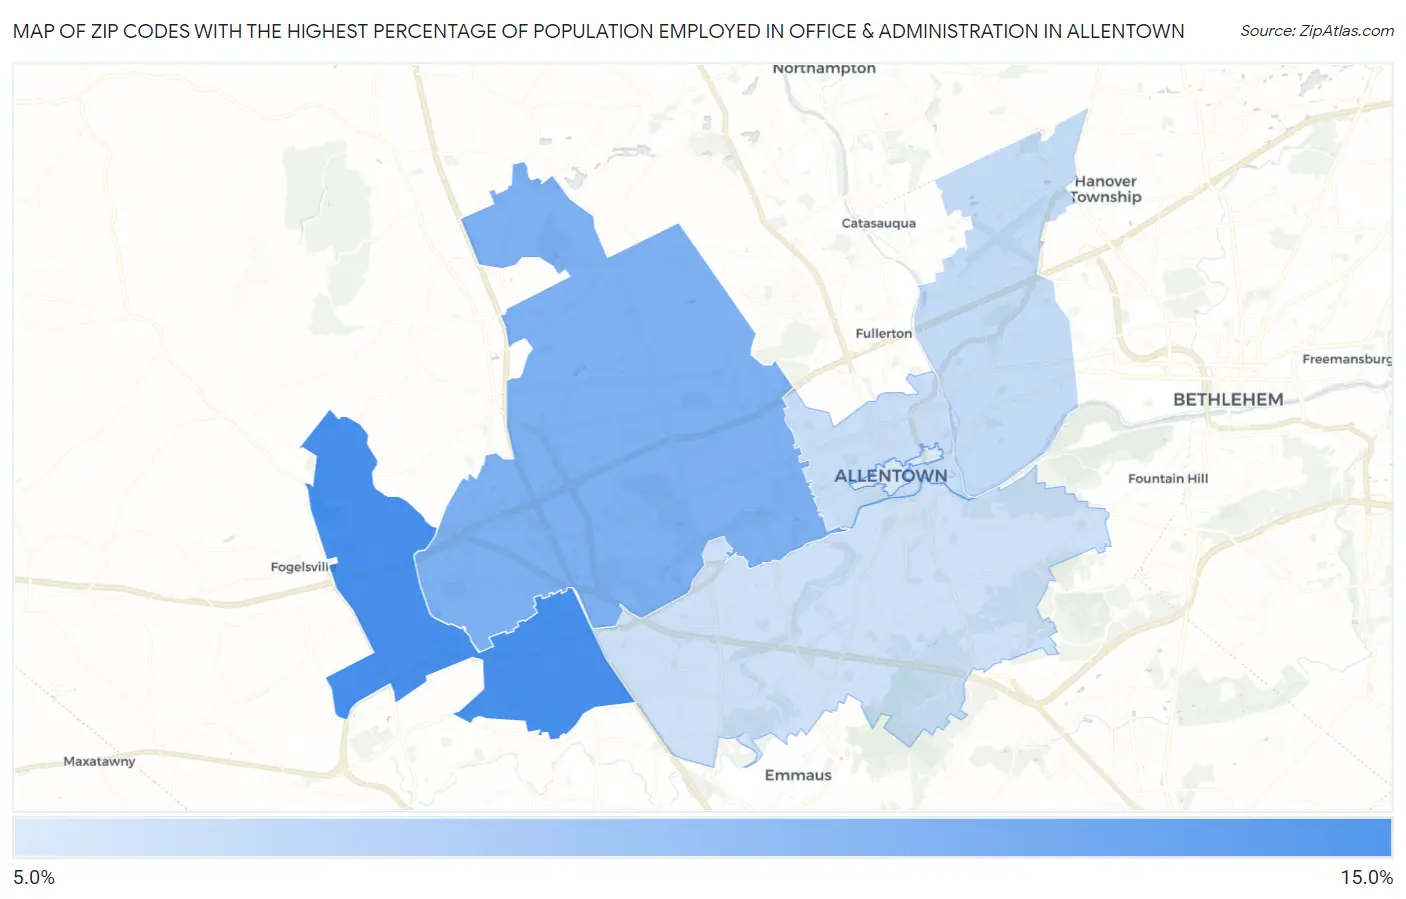
Zip Codes with the Highest Percentage of Population Employed in Office & Administration in Allentown, PA
RELATED REPORTS & OPTIONS
Office & Administration
Allentown
Compare Zip Codes
Map of Zip Codes with the Highest Percentage of Population Employed in Office & Administration in Allentown
0.0%
15.0%
Zip Codes with the Highest Percentage of Population Employed in Office & Administration in Allentown, PA
| Zip Code | % Employed | vs State | vs National | |
| 1. | 18106 | 13.6% | 10.9%(+2.70)#412 | 10.9%(+2.73)#6,745 |
| 2. | 18104 | 12.2% | 10.9%(+1.35)#592 | 10.9%(+1.38)#10,029 |
| 3. | 18109 | 10.4% | 10.9%(-0.457)#935 | 10.9%(-0.425)#15,715 |
| 4. | 18102 | 10.3% | 10.9%(-0.625)#963 | 10.9%(-0.593)#16,287 |
| 5. | 18103 | 10.1% | 10.9%(-0.784)#988 | 10.9%(-0.753)#16,786 |
| 6. | 18101 | 9.8% | 10.9%(-1.12)#1,045 | 10.9%(-1.09)#17,866 |
1
Common Questions
What are the Top 5 Zip Codes with the Highest Percentage of Population Employed in Office & Administration in Allentown, PA?
Top 5 Zip Codes with the Highest Percentage of Population Employed in Office & Administration in Allentown, PA are:
What zip code has the Highest Percentage of Population Employed in Office & Administration in Allentown, PA?
18106 has the Highest Percentage of Population Employed in Office & Administration in Allentown, PA with 13.6%.
What is the Percentage of Population Employed in Office & Administration in Allentown, PA?
Percentage of Population Employed in Office & Administration in Allentown is 11.1%.
What is the Percentage of Population Employed in Office & Administration in Pennsylvania?
Percentage of Population Employed in Office & Administration in Pennsylvania is 10.9%.
What is the Percentage of Population Employed in Office & Administration in the United States?
Percentage of Population Employed in Office & Administration in the United States is 10.9%.