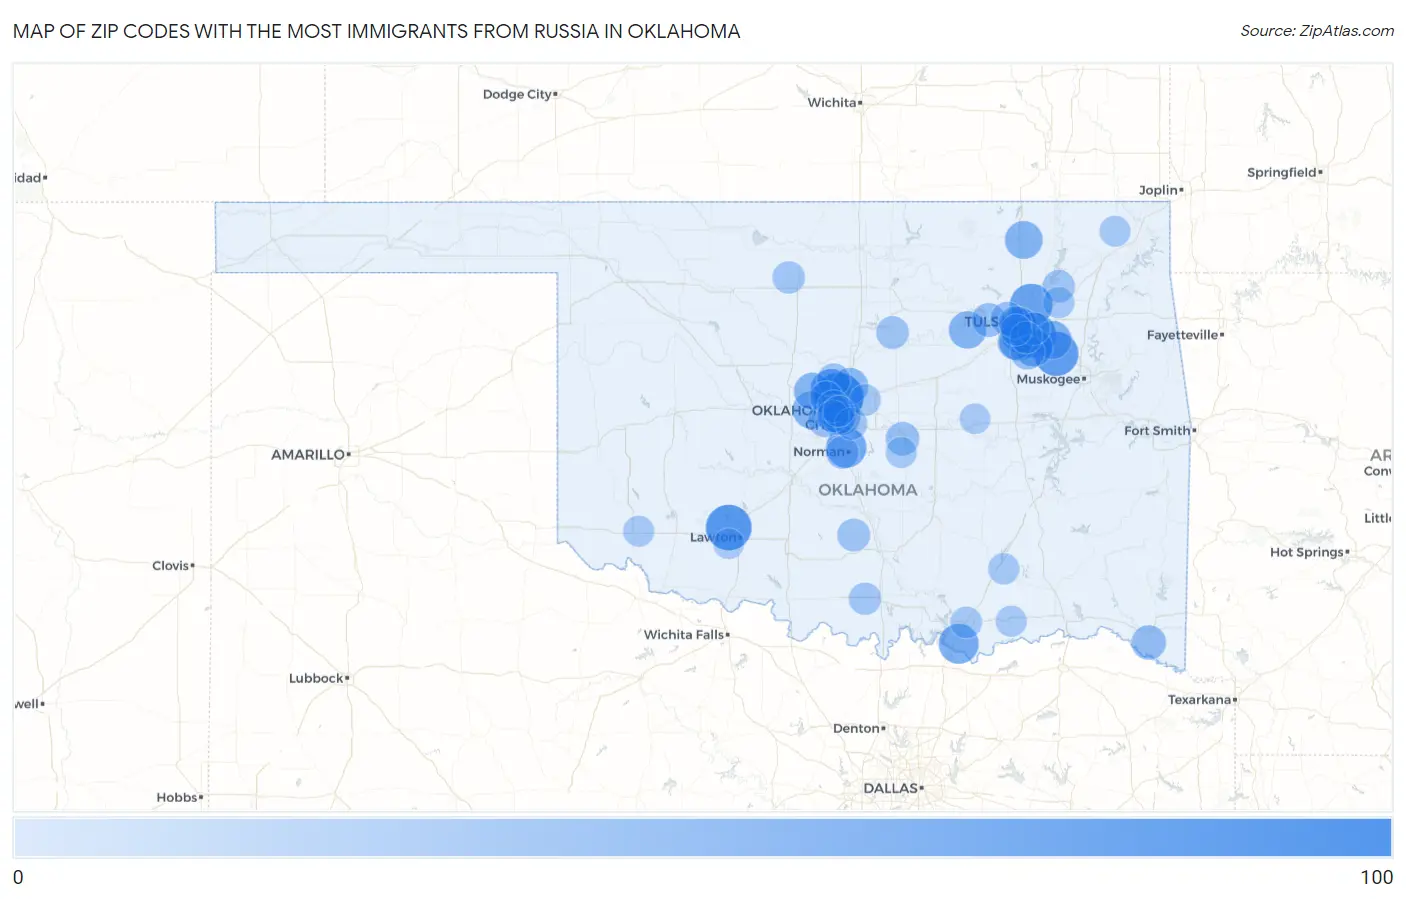
Zip Codes with the Most Immigrants from Russia in Oklahoma
RELATED REPORTS & OPTIONS
Russia
Oklahoma
Compare Zip Codes
Map of Zip Codes with the Most Immigrants from Russia in Oklahoma
0
100
Zip Codes with the Most Immigrants from Russia in Oklahoma
| Zip Code | Russia | vs State | vs National | |
| 1. | 73013 | 95 | 1,321(7.19%)#1 | 406,732(0.02%)#1,048 |
| 2. | 73503 | 76 | 1,321(5.75%)#2 | 406,732(0.02%)#1,326 |
| 3. | 74012 | 71 | 1,321(5.37%)#3 | 406,732(0.02%)#1,416 |
| 4. | 74429 | 69 | 1,321(5.22%)#4 | 406,732(0.02%)#1,472 |
| 5. | 74055 | 60 | 1,321(4.54%)#5 | 406,732(0.01%)#1,677 |
| 6. | 73012 | 56 | 1,321(4.24%)#6 | 406,732(0.01%)#1,802 |
| 7. | 73069 | 49 | 1,321(3.71%)#7 | 406,732(0.01%)#2,073 |
| 8. | 74135 | 48 | 1,321(3.63%)#8 | 406,732(0.01%)#2,128 |
| 9. | 74733 | 47 | 1,321(3.56%)#9 | 406,732(0.01%)#2,184 |
| 10. | 74137 | 41 | 1,321(3.10%)#10 | 406,732(0.01%)#2,416 |
| 11. | 74014 | 38 | 1,321(2.88%)#11 | 406,732(0.01%)#2,558 |
| 12. | 73104 | 38 | 1,321(2.88%)#12 | 406,732(0.01%)#2,597 |
| 13. | 74011 | 37 | 1,321(2.80%)#13 | 406,732(0.01%)#2,620 |
| 14. | 74006 | 36 | 1,321(2.73%)#14 | 406,732(0.01%)#2,678 |
| 15. | 73106 | 35 | 1,321(2.65%)#15 | 406,732(0.01%)#2,745 |
| 16. | 73099 | 34 | 1,321(2.57%)#16 | 406,732(0.01%)#2,757 |
| 17. | 74044 | 34 | 1,321(2.57%)#17 | 406,732(0.01%)#2,796 |
| 18. | 73078 | 32 | 1,321(2.42%)#18 | 406,732(0.01%)#2,925 |
| 19. | 73034 | 30 | 1,321(2.27%)#19 | 406,732(0.01%)#3,023 |
| 20. | 74114 | 30 | 1,321(2.27%)#20 | 406,732(0.01%)#3,065 |
| 21. | 74136 | 27 | 1,321(2.04%)#21 | 406,732(0.01%)#3,242 |
| 22. | 74037 | 20 | 1,321(1.51%)#22 | 406,732(0.00%)#3,886 |
| 23. | 74745 | 20 | 1,321(1.51%)#23 | 406,732(0.00%)#3,921 |
| 24. | 74008 | 18 | 1,321(1.36%)#24 | 406,732(0.00%)#4,057 |
| 25. | 73128 | 18 | 1,321(1.36%)#25 | 406,732(0.00%)#4,121 |
| 26. | 74063 | 17 | 1,321(1.29%)#26 | 406,732(0.00%)#4,168 |
| 27. | 74127 | 17 | 1,321(1.29%)#27 | 406,732(0.00%)#4,223 |
| 28. | 74801 | 16 | 1,321(1.21%)#28 | 406,732(0.00%)#4,306 |
| 29. | 73025 | 13 | 1,321(0.98%)#29 | 406,732(0.00%)#4,710 |
| 30. | 73112 | 12 | 1,321(0.91%)#30 | 406,732(0.00%)#4,806 |
| 31. | 73433 | 12 | 1,321(0.91%)#31 | 406,732(0.00%)#4,924 |
| 32. | 73072 | 11 | 1,321(0.83%)#32 | 406,732(0.00%)#4,945 |
| 33. | 74074 | 11 | 1,321(0.83%)#33 | 406,732(0.00%)#4,973 |
| 34. | 74134 | 11 | 1,321(0.83%)#34 | 406,732(0.00%)#5,006 |
| 35. | 73142 | 11 | 1,321(0.83%)#35 | 406,732(0.00%)#5,033 |
| 36. | 74120 | 11 | 1,321(0.83%)#36 | 406,732(0.00%)#5,080 |
| 37. | 73102 | 11 | 1,321(0.83%)#37 | 406,732(0.00%)#5,093 |
| 38. | 73703 | 10 | 1,321(0.76%)#38 | 406,732(0.00%)#5,153 |
| 39. | 74017 | 10 | 1,321(0.76%)#39 | 406,732(0.00%)#5,154 |
| 40. | 73116 | 9 | 1,321(0.68%)#40 | 406,732(0.00%)#5,415 |
| 41. | 73443 | 9 | 1,321(0.68%)#41 | 406,732(0.00%)#5,446 |
| 42. | 74133 | 8 | 1,321(0.61%)#42 | 406,732(0.00%)#5,476 |
| 43. | 73107 | 8 | 1,321(0.61%)#43 | 406,732(0.00%)#5,527 |
| 44. | 73145 | 8 | 1,321(0.61%)#44 | 406,732(0.00%)#5,626 |
| 45. | 74701 | 6 | 1,321(0.45%)#45 | 406,732(0.00%)#5,863 |
| 46. | 73049 | 6 | 1,321(0.45%)#46 | 406,732(0.00%)#5,921 |
| 47. | 74105 | 5 | 1,321(0.38%)#47 | 406,732(0.00%)#6,027 |
| 48. | 74019 | 5 | 1,321(0.38%)#48 | 406,732(0.00%)#6,039 |
| 49. | 73118 | 5 | 1,321(0.38%)#49 | 406,732(0.00%)#6,053 |
| 50. | 74525 | 5 | 1,321(0.38%)#50 | 406,732(0.00%)#6,064 |
| 51. | 74873 | 3 | 1,321(0.23%)#51 | 406,732(0.00%)#6,376 |
| 52. | 74723 | 3 | 1,321(0.23%)#52 | 406,732(0.00%)#6,464 |
| 53. | 74333 | 3 | 1,321(0.23%)#53 | 406,732(0.00%)#6,478 |
| 54. | 73523 | 3 | 1,321(0.23%)#54 | 406,732(0.00%)#6,499 |
| 55. | 73505 | 2 | 1,321(0.15%)#55 | 406,732(0.00%)#6,505 |
| 56. | 74859 | 1 | 1,321(0.08%)#56 | 406,732(0.00%)#6,718 |
Common Questions
What are the Top 10 Zip Codes with the Most Immigrants from Russia in Oklahoma?
Top 10 Zip Codes with the Most Immigrants from Russia in Oklahoma are:
What zip code has the Most Immigrants from Russia in Oklahoma?
73013 has the Most Immigrants from Russia in Oklahoma with 95.
What is the Total Immigrants from Russia in the State of Oklahoma?
Total Immigrants from Russia in Oklahoma is 1,321.
What is the Total Immigrants from Russia in the United States?
Total Immigrants from Russia in the United States is 406,732.