Zip Codes with the Highest Percentage of Population Employed in Administrative & Support Services in Cuyahoga Falls, OH
RELATED REPORTS & OPTIONS
Administrative & Support Services
Cuyahoga Falls
Compare Zip Codes
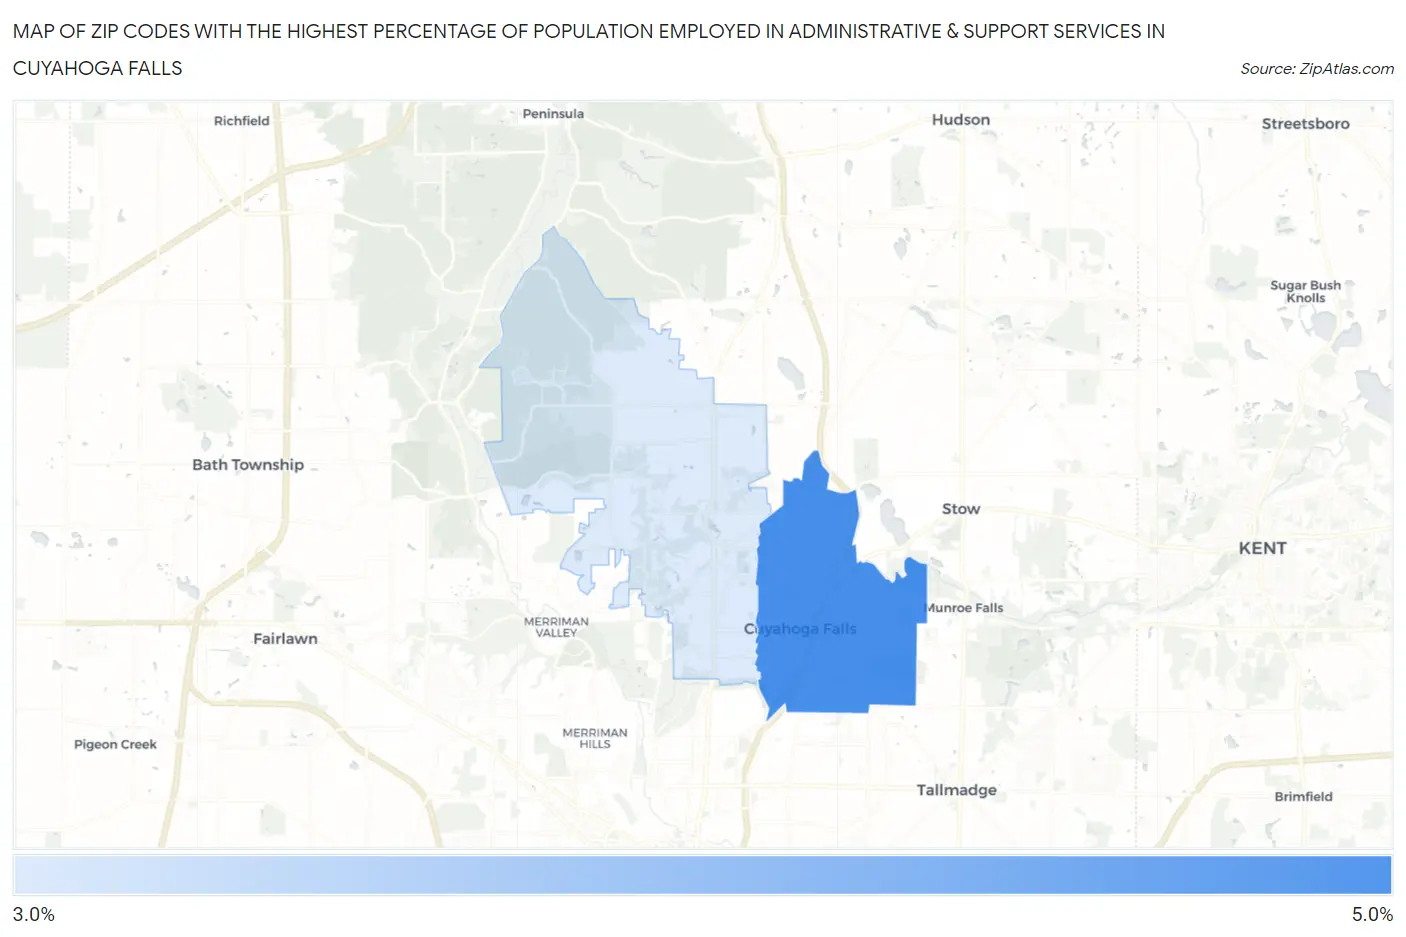
Map of Zip Codes with the Highest Percentage of Population Employed in Administrative & Support Services in Cuyahoga Falls
0.0%
5.0%
Zip Codes with the Highest Percentage of Population Employed in Administrative & Support Services in Cuyahoga Falls, OH
| Zip Code | % Employed | vs State | vs National | |
| 1. | 44221 | 4.5% | 3.7%(+0.782)#338 | 4.1%(+0.357)#8,700 |
| 2. | 44223 | 3.3% | 3.7%(-0.431)#535 | 4.1%(-0.857)#13,980 |
1
Common Questions
What are the Top Zip Codes with the Highest Percentage of Population Employed in Administrative & Support Services in Cuyahoga Falls, OH?
Top Zip Codes with the Highest Percentage of Population Employed in Administrative & Support Services in Cuyahoga Falls, OH are:
What zip code has the Highest Percentage of Population Employed in Administrative & Support Services in Cuyahoga Falls, OH?
44221 has the Highest Percentage of Population Employed in Administrative & Support Services in Cuyahoga Falls, OH with 4.5%.
What is the Percentage of Population Employed in Administrative & Support Services in Cuyahoga Falls, OH?
Percentage of Population Employed in Administrative & Support Services in Cuyahoga Falls is 3.9%.
What is the Percentage of Population Employed in Administrative & Support Services in Ohio?
Percentage of Population Employed in Administrative & Support Services in Ohio is 3.7%.
What is the Percentage of Population Employed in Administrative & Support Services in the United States?
Percentage of Population Employed in Administrative & Support Services in the United States is 4.1%.