Zip Codes with the Highest Percentage of Black / African American Population in Bowling Green, OH
RELATED REPORTS & OPTIONS
Black / African American
Bowling Green
Compare Zip Codes
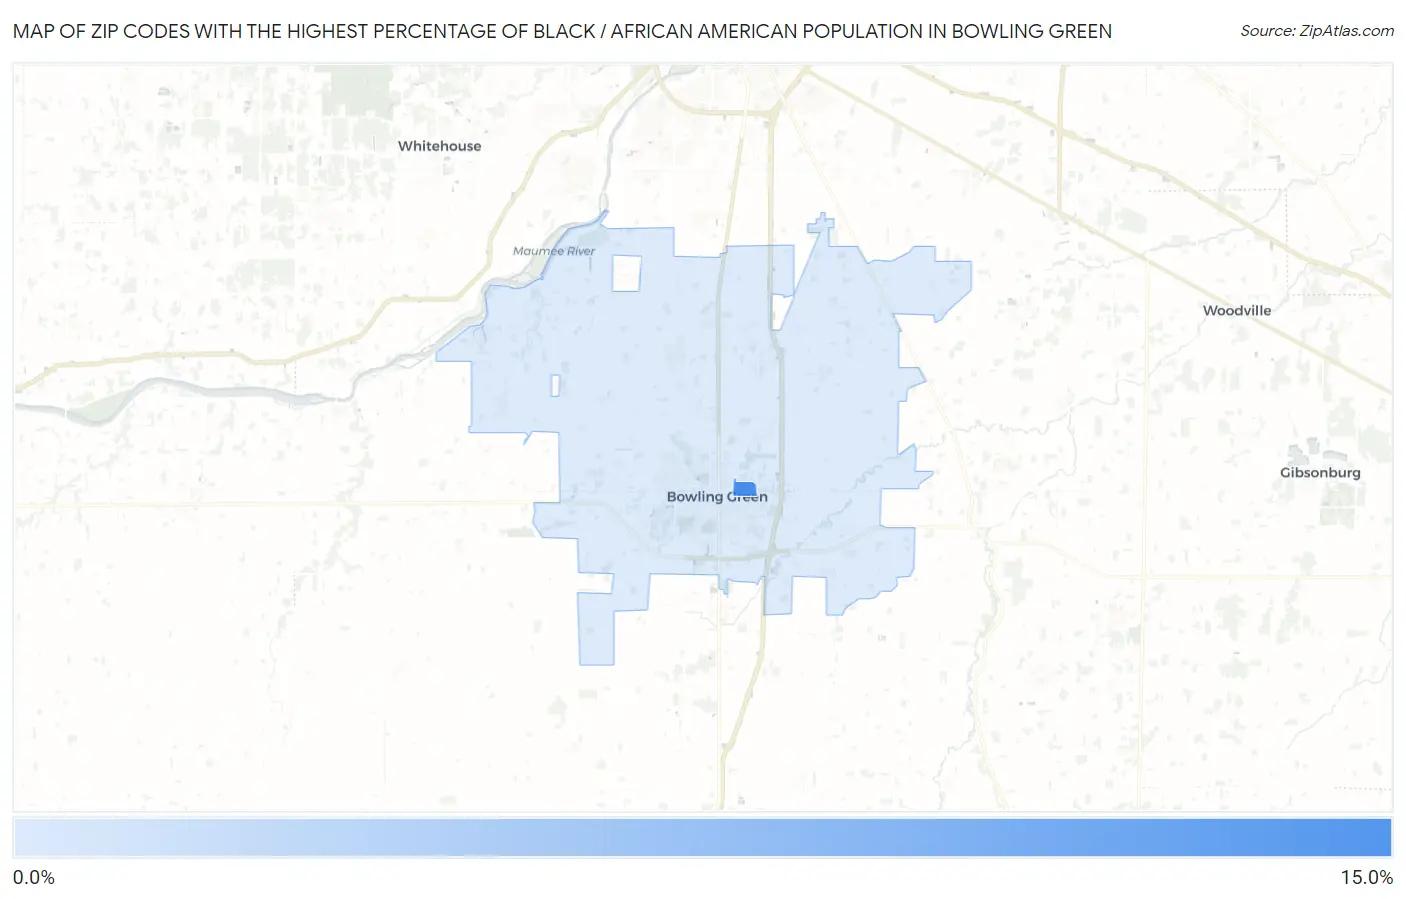
Map of Zip Codes with the Highest Percentage of Black / African American Population in Bowling Green
0.0%
15.0%
Zip Codes with the Highest Percentage of Black / African American Population in Bowling Green, OH
| Zip Code | Black / African American | vs State | vs National | |
| 1. | 43403 | 12.1% | 12.3%(-0.247)#181 | 12.5%(-0.408)#5,856 |
| 2. | 43402 | 3.4% | 12.3%(-8.89)#338 | 12.5%(-9.05)#11,159 |
1
Common Questions
What are the Top Zip Codes with the Highest Percentage of Black / African American Population in Bowling Green, OH?
Top Zip Codes with the Highest Percentage of Black / African American Population in Bowling Green, OH are:
What zip code has the Highest Percentage of Black / African American Population in Bowling Green, OH?
43403 has the Highest Percentage of Black / African American Population in Bowling Green, OH with 12.1%.
What is the Percentage of Black / African American Population in Bowling Green, OH?
Percentage of Black / African American Population in Bowling Green is 5.3%.
What is the Percentage of Black / African American Population in Ohio?
Percentage of Black / African American Population in Ohio is 12.3%.
What is the Percentage of Black / African American Population in the United States?
Percentage of Black / African American Population in the United States is 12.5%.